|
|
|
|
Excel Simulation
|

|
This is a story adapted from The Goal by Goldratt. We use it to
describe a sequential production process. Further, this process
is used to explain the idea of simulation.This simulation is accomplished
using Excel with the Simulation add-in. |
|
|
| We start with a big pile of matches to the
left of the first boy. Boy 1 throws a single die. The number
showing is his production, so in this case the first boy
produces 4 matches. These matches are the raw materials
for the second boy. |
|

|
|
| The second boy throws the die. His production
capability is the amount shown on the die, but he can only
produce as much as available from the first boy. His production
is the minimum of his capability or the number remaining
from the first boy. There are 4 matches available, but the
capacity of the second boy is only 2. He passes these to
the third boy, leaving 2 matches remaining with the first
boy. These two are called work in progress (WIP). |
|

|
|
| The raw materials for the third boy are the
matches provided by the second boy. Again, he produces the
minimum on his die or the matches available. His production
is the system output. For this case the capacity of the
third boy is 5, but only 2 matches are available as raw
material. The remaining 3 units of capacity are wasted.
At this first iteration, the system produces 2 matches.
Two matches remain in the system as the first boy's WIP.
The WIP is available to processed in the next iteration. |
|

|
|
|
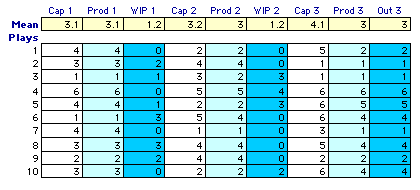
The boys continue to play the game. Each play consists
of three rolls of the die that define the capacities of
the boys. The production of each boy is limited by his
capacity and the amount of material available. Ten plays
of the game are shown below. Averages over the ten plays
are shown at the top of the table. The play illustrated
above is shown on row 1. The WIP produced in the first
play is shown in the WIP 1 column of row 2.

We see from these ten plays, that the average
system output is 3 units. The WIP that gathers after the
first and second boys varies over the play of the game.
We would like to estimate the long term properties of
this game.
- What is the average production of this system per
play of this game?
- How do you expect the piles of matches between the
boys (the WIP) to vary as the game progresses?
- Using this example, explain the effects of the variability
in capacity on system output and in-process inventory
(WIP).
|
|
|

