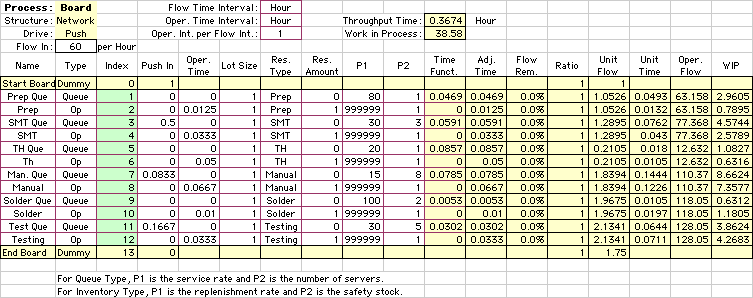
Board Manufacture with Queues
|
Data representing the board manufacturing facility is shown below. The structure is a Push Network. Note that we have added separate operations to model queues. The queue residence times are in the time function column. The throughput time and WIP are much higher with queues that without.
The matrix showing transfer probabilities between operations is shown below. Each queue receives all the inputs, while the queues transfer directly into the following processing operations.
The Economic Analysis shows the resource utilization. The resource utilization does not change due to queuing.
The From-To matrix shows more flow through each operation. This is primarily due to the flow from a queue to its processing operation.
Click here to see the Excel workbook. |


