Return to Index
Operations Research Models and Methods
 
Models Section


Models

Nonlinear Objective

The Problem

Unsuccessful Model

Successful Model

Nonlinear Objective
Unsuccessful Model

We begin the discussion on models with an unsuccessful model. It will still be useful, however, as a base for the successful model described on the next page.

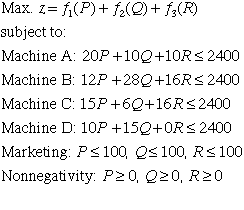
A mathematical programming model of the problem is given below with nonlinear functions representing the profit terms.  The variables P, Q and R correspond to the number of units of each product manufactured. The four machine constraints restrict the total time used for production to no greater than the time available. The bound constraints restrict the total production to no greater than the market can absorb.
To linearize this model, we identify three market segments for each product.

The objective expressed in terms of the new variables is linear. We repeat the machine constraints in terms of the original variables.
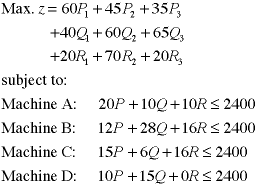
We must add constraints to link the new variables with the original variables P, Q and R.

We include simple upper bounds on the new variables to represent the size of the market segment.

The new model is a linear program with the solution below.


Unfortunately, the solution does not reflect the original situation. Focusing on product P we see that the total produced is 87.27, of which 30 are sold for $60, 30 are sold for $45, and the remaining 27.27 are sold for $35. This is as it should be and the model is correct because the profit function for P is concave. When we look at product Q, however, we see that all of the 25.45 produced is sold for $65 each. But this is in the 3rd market segment, not the first. This is not correct because we must sell all of the first two segments, before the 3rd can be used. Similarly we see that the entire production of R is obtained from the second segment, and none from the first.

Without additional variables and constraints the LP model does not work. In the search for optimality, the algorithm will surely use the variables representing a particular product in the order of decreasing profit, with the highest unit profit segment used first. This is fine for product P, because the profit function is concave. It fails for Q and R because those profit functions are not concave. It is a general truth that piecewise linear concave functions can be modeled successfully with LP, but functions which are not concave cannot.


Return to Top

tree roots

Operations Research Models and Methods
Internet
by Paul A. Jensen
Copyright 2004 - All rights reserved