|
|
 |
Dynamic
Programming
Data |
 |
-
Birth-Death: Markov Chain Data |
Data for the CTMC |
 |
|
The program allows three types of models,
the two kinds of Markov Chains (DTMC or CTMC) or the stochastic
programming model (MDP). There is no DDP model provided for
the birth-death process. The selection at the left creates
the CTMC model.
The are no decisions for the Markov chain models. A purge
or balk occurs only when the population is at its maximum.
The MDP model allows the action of balking or purging at intermediate
populations. Thus we have actions of purge or not purge, or
balk or not balk. |
| |
|
The Birth-Death dialog is to the left. The Model
Name field accepts a name for the problem. A default name
is provided, but it may be changed. We specify that the birth
and death rates are constant (not affected by the population)
by leaving the Different Rates box unchecked. The Max.
State Index field specifies the maximum population, but
this can be changed on the data table. Checking the Make
Random Problem box fills the data form with random data
when the Different Rates option is selected. |
| |
|
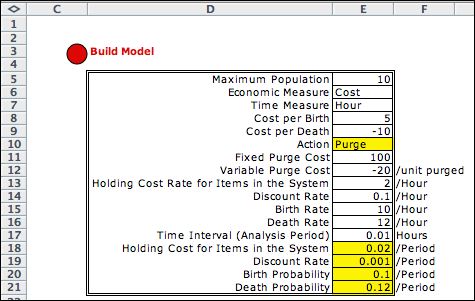
The maximum population determines the size of
the model and the corresponding solution effort. Other table
entries describe time and economic measures. When cost is the
economic measure, a negative value indicates revenue. Costs are
specified for births, deaths, a fixed cost for purging and a
variable cost of purging (it is multiplied by the population
at the purge event), and a cost for holding an item in the system
for one unit of the time measure. The discount rate is important
for some applications and it should be a nonnegative fraction.
The birth and death rates are specified per unit of the time
measure (hours in this case). For the case considered here, the
birth and death rates are constant with respect to the population.
The action entry, Purge, is colored yellow because it
determines the form of the model that will be constructed. It
cannot be changed, but all the white data cells can be changed.
Changes are immediately reflected in the model. |
| |
The
expression for cost model for one period is below. The equation
is for the purge action. We use the notation IF(Event, Cost
of Event, 0) to indicate that if the event occurs the cost
of the event is expended during the period, otherwise the cost
is zero. The cost depends on the population.
Cost per period = (Population)*(Holding Cost
per period) + IF(Death, Cost of Death, 0) + IF(Birth, Cost
of Birth, 0)
+ IF(Purge, Fixed Cost of Purge + (Variable
Cost of Purge)*(Population + 1), 0)
Although we have used the general terms birth and death the
model could represent a variety of situations. For example a
birth might represent an arrival of an order to some supplier,
and the corresponding cost would be the cost of the raw materials
for that order. The death event in this context would be the
service completion event, where the cost would be the revenue
obtained for the service ( a negative number represents a revenue).
The holding cost would be the cost of holding an order before
it is completed. A purge might represent some batch process that
completes several orders at the same time. Here we have a fixed
cost of 100 for the purge with a revenue for items completed
with the purge operation. |
Data for the DTMC |
| |
The DTMC
is created by the same process except the DTMC is selected
in the dialog. The DTMC model requires event probabilities
rather than event rates, so to approximate the exponential
distributions of the birth-death process we define a time
interval that should be small relative to the rates. We use
0.01 for the example. In general:
Event Probability = (Event
Rate)*(Time Interval)
For the example with a time interval of 0.01,
Birth Probability = 10*0.01 = 0.1
Death Probability = 12*0.01 = 0.12
The time interval chosen must be small enough
that probabilities are considerably nearer to 0 than 1.
The discrete approximation to the birth-death process assumes
that only one event occurs in an interval. The assumption
is better with very small intervals.
|
|
|

|
The probabilities are computed
in the bottom two rows of the data form. The holding cost
and discount rate are computed from the continuous cases by
multiply the associated rate values of the continuous case
by the time interval. |
Data with Different Birth-Death Rates |
| |
Clicking the Different
Rates box on the birth-death dialog, reveals the data
structure below. The figure shows the DTMC data. The data
now provides a vectors of arrival and departure rates, so
models can reflect changing values. The vectors have dimension
of the maximum population. The maximum population can be
changed on the data form, but should not increase beyond
the size of the data vectors. |
|
| |
|
|


