To illustrate the data feature
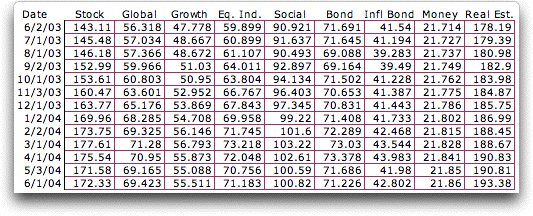
of the add-in, we obtained the monthly unit values for the
asset funds of the CREF annuity investment account. This account
is administered by TIAA-CREF.
The data for one year is shown below.

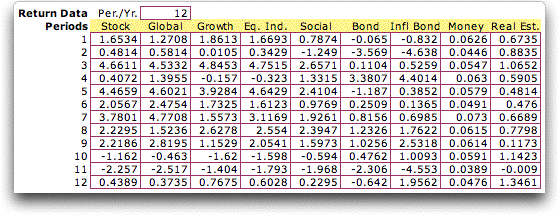
We compute the monthly return for each fund with
the formula:
100*(BV - EV)/BV
BV is the unit value at the beginning of the
month, EV is the value at the end of the month. We multiply
by 100 to express the returns as percentages. The resultant
table of returns is below. The table is in the format of the
Equity add-in. The number of periods (months) per year is 12.

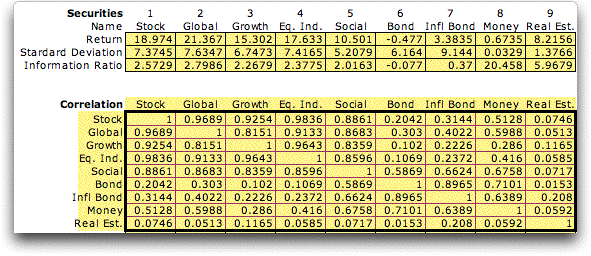
Statistical analysis, using Excel statistical
functions, computes the fund average returns and standard
deviations. The formulas for the Stock fund are below. Returns
and standard deviations are annualized using the Cref_Per_Yr variable
(12 in this case).
For example, the Stock fund
provided almost an 19% return for the year. The annual equivalent
of the standard deviation of the Stock data is 7.3745.
=CREF_Per_Yr*AVERAGE(CREF_Return1)
=SQRT(CREF_Per_Yr)*STDEV(CREF_Return1)
The correlation matrix is computed from pairs
of data columns using the Excel CORREL function. Note
that all the correlations are positive in this case.

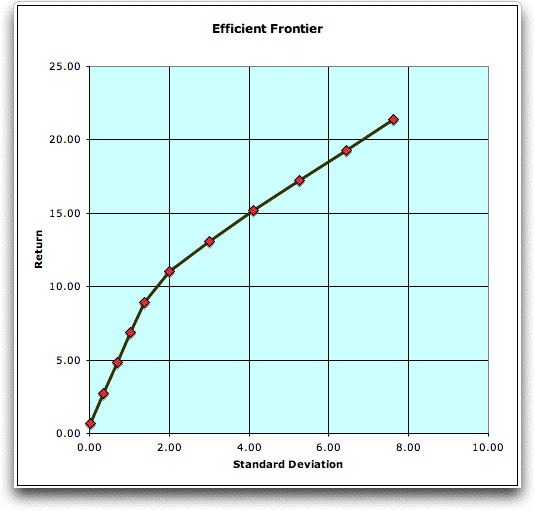
Solutions on the efficient frontier with ten
intervals are found using the add-in.

The return and standard deviations for eleven
solutions determine the efficient frontier graph.

The minimum variance portfolio uses only the
Money Market investment (the first solution shown is not quite
the minimum variance solution). The maximum return solution
(with maximum variance) invests in only Global Equities.
Intermediate solutions use a combination of Money Market, Real
Estate and Global Equities. The best portfolio for a specific
investor depends on his or her risk preference. Our example
uses only one year of data. The results would probably change
if a longer history were used. |


