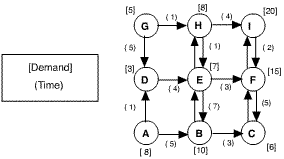
The figure below shows a network of streets. Nodes represent intersections,
and ambulance stations are located at nodes A and G. The monthly
calls for ambulance service appears adjacent to each node. Each
station can serve a maximum of 50 calls for service during the
month.
Arcs represent streets, and the travel time in minutes for
a single trip is shown adjacent to each arc. The directions
indicated for each arc show the direction traveled on the outbound
trip for the ambulance. If an ambulance uses a street to travel
to some node, it uses the same street in the reverse direction
to return to the station.
Use a linear network flow model to identify the set of nodes
to be served by each station and the paths that an ambulance
will take to each of the nodes. The goal is to minimize the
total travel time during the month.

|


