|
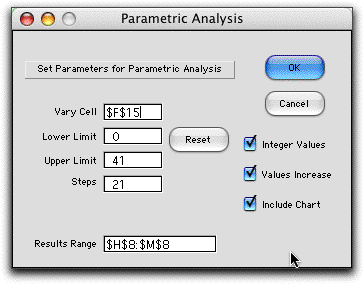
A dialog is presented for entering the data concerning the
analysis. The Vary Cell is the address of a single
cell on the worksheet. For the example we choose cell F15, however
any cell whose value is relevant to the solution may be chosen.
The example is the right-side value for the first constraint.
The dollar signs in the cell reference are not necessary.

The next two fields hold the Lower and
Upper limits on the range over which the parameter
will vary. The Steps entry indicates the number of
intervals into which the range will be divided. The Results
Range specifies a range on the worksheet that will change
with the parameter. The default value is the solution range,
however, the range may be changed to show other values of interest.
The range must be a single row or column of cells.
The check boxes at the right indicate respectively
whether the parameter is to be restricted to integer values,
whether the values will increase or decrease as the parameter
is varied, and whether the add-in is to construct a chart of
the objective function value as a function of the parameter.
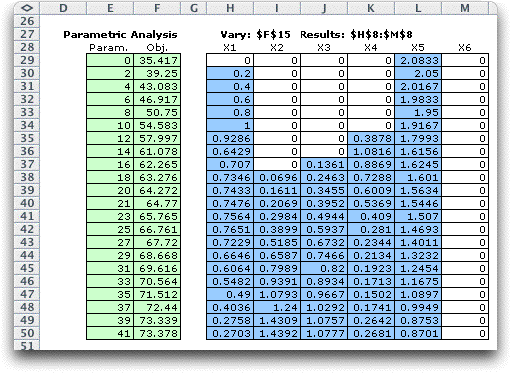
The table below shows the results obtained when
the right-side of the first constraint is varied. The first
column (E) holds the parameter values. Note that the differences
between adjacent values are not equal. This is due to the
rounding necessary to obtain integer values. The second column
(F) gives the objective function values for each parameter
setting. The remaining columns (H through M) give the solution
values. Nonzero values are highlighted in blue. For the example,
we can clearly see that the linear programming basis changes
as the parameter increases.

In the example we find a feasible solution for
all parameter values within the range, but for nonlinear cases
it is possible that there may be no feasible solution for some
values of the parameter. Starting from the initial value (0
in this case), the program will solve the model. If no feasible
solution is found, but the parameter increases until a feasible
solution is found. Once a feasible solution is found, the parameter
continues to change until an infeasible solution is again found.
Then the process stops. Feasible solutions are shown, but values
of the parameter that find no feasible solution are skipped.
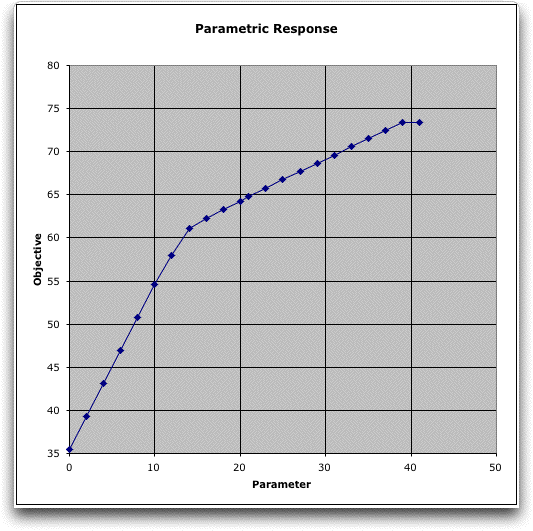
A chart showing the objective value as a function
of the parameter value is constructed below the table. It should
not be surprising that the curve is convex with respect to the
parameter value.

|


