|
|
 |
Hidden
Iterations |
 |
|
 |
|
 |
Simulating many iterations on a worksheet requires many rows
with perhaps complex functions in each. This will expand the
Excel's memory requirements and the computational effort required
for a simulation. The add-in provides a procedure that displays
only a relatively few rows of the simulation, yet allows the
sample size to be very large. We illustrate this feature with
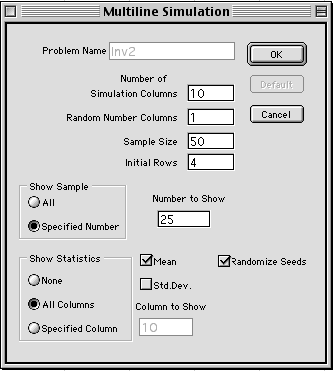
the built-in inventory model. After accepting the model parameters,
the Simulation dialog appears as below. Note that we have indicated
a sample size of 50, however, in the Show Sample region,
the Specified Number option is selected. To the right,
the Number to Show field has been given the value 25.
This means that only 25 of the iterations of the sample will
be shown on the worksheet, but a simulation run will include
the entire sample size of 50. We use 25 and 50 in this example,
but usually the sample size will be much greater than the number
of iterations to be shown.
Pressing OK for this dialog, builds the worksheet
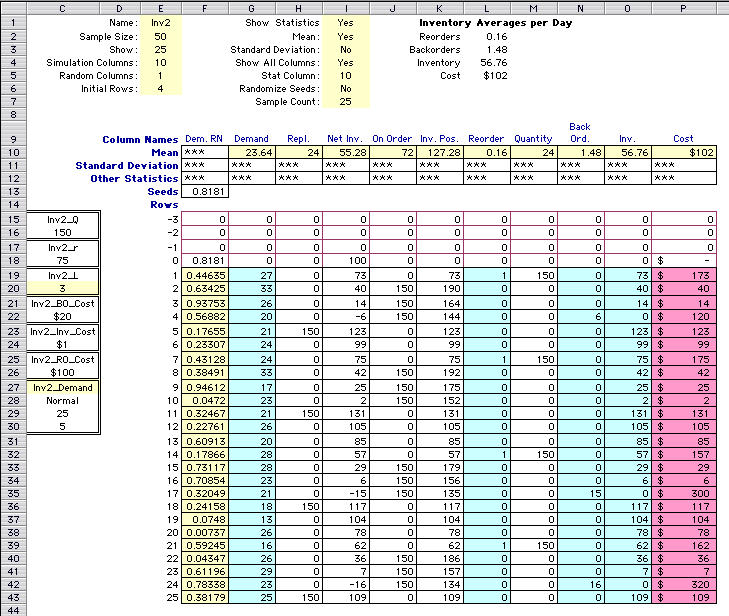
for the inventory model. The image below shows the worksheet
as it is initially constructed. Only the first 25 days are shown.
The Sample Size and Show parameters at the top
of the worksheet come from the dialog. The Sample Count
in column I, which is currently 25, shows that the first 25
of the iterations are simulated directly on the worksheet.
|
| |
Pressing the Simulation button in column A (not shown
in the image) initiates the simulation run. The computer uses
the display of 25 rows to perform the 50 iterations required
for the sample. Because 50 divided by 25 is equal to 2, two
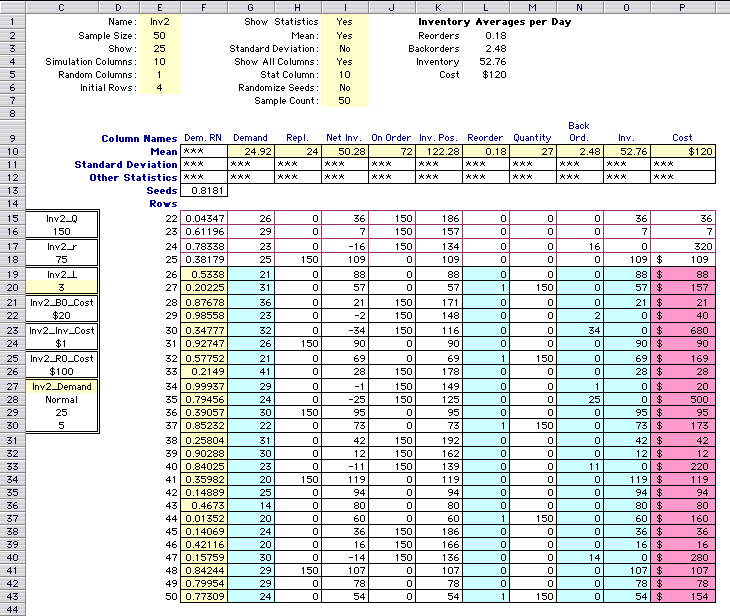
25 iteration replications are required. The image below shows
the second replication. The second replication is a continuation
of the first because the last four lines in the first replication
are pasted into the initial rows region of the display. Only
the values are pasted. The sample count cell in row I indicates
that the simulation is complete.
|
| |
The cumulative statistics for the entire sample are computed
by the program and stored in the rows labeled Mean and
Standard Deviation. The statistics shown in the example
are for the entire 50 iterations.
|
 |
Two other buttons are in column A. The Initialize button,
returns the simulation model to its initial state, showing the
first 25 iterations. The Simulate button repeats the
simulation. If the Randomize Seeds option has been selected,
each simulation will be given a new set of seeds.
|
| |
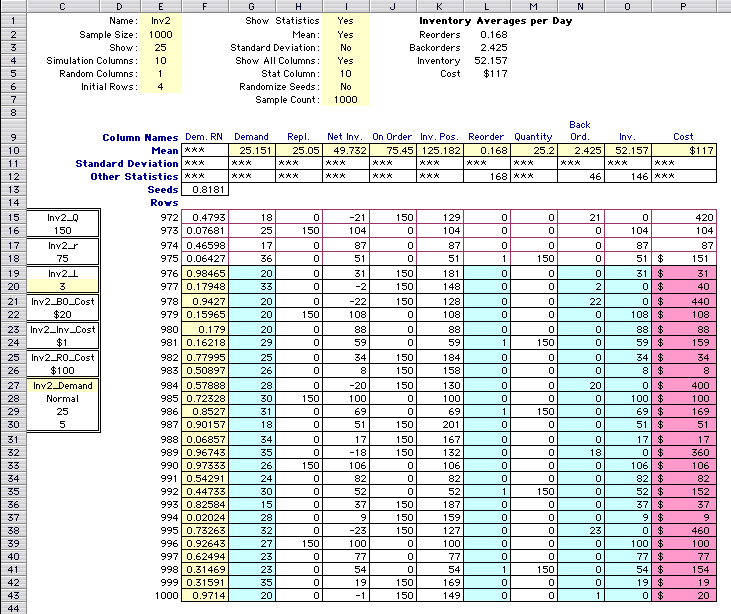
Changing the sample size is accomplished by clicking the Change
button. In the image below, we have changed the sample size
and repeated the simulation. The display shows the last replication
of the 40 replications of 25 iterations to simulate 1000 iterations.
All the operations required for the ismulation are performed
automatically, and only the first and last replications are
shown. The simulation only used a few seconds on the author's
computer.
|
| |
The image shows a new feature. We have placed additional statistics
in the Other Statistics row of the worksheet.
|
Cell
|
Formula |
Description |
|
L12
|
=SUM(L19:L43) |
This computes the sum of the reorder column. When the
simulation is complete it shows the number of orders placed
during the 1000 days.
|
| N12 |
=MAX(N19:N43) |
This computes the maximum number
in the backorder column. It is the maximum number if backorders
at the end of the day during the entire simulated time. |
| O12 |
=MAX(O19:O43) |
This computes the maximum number
in the inventory column. It is the maximum amount in inventory
at the end of the day during the entire simulated time. |
These statistics are computed with Excel statistical functions.
There are many different types of statistics that might be of
interest, but only a few are available with hidden iterations.
They are: SUM, MAX and MIN.
The hidden iterations option of the add-in can be very useful
to simulate large sample size without requiring a great number
of cells on the worksheet. This facility does come with a price
however. No longer is the simulation dynamic. This makes it
more difficult to experiment with alternative parameter selections.
For the example, it would be more difficult to find the optimum
reorder point and lot size, because trial and error is much
more easily accomplished with a dynamic simulation.
|
|


