|
|
 |
Do
it Yourself |
 |
-
ORMM Functions |
| |
A function is a program component that returns a result.
It can be used in VBA programs or used directly in a cell
of the worksheet. Many of the add-ins provide functions
that can be used directly on a user's worksheet without
the data forms constructed by the add-in. When the add-in
is installed, the functions available to the user are listed
in the user-defined function category of Excel's
function list. The list is obtained by choosing the Paste
Function command that appears with a script fx
icon on the Standard Toolbar. The list is also
displayed with the Insert/Function command from
the Insert menu item as shown at the left.
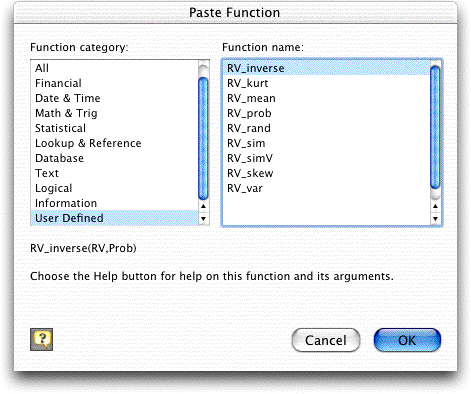
The list when the Random Variables add-in installed
is illustrated below. In this case the complete list of
functions is shown in the dialog. For other add-ins the
last may too long to display and the scroll bar must be
used to see them. In the following we show long add-in lists
with several screen shots. Because of scrolling limitations,
some names near the bottom of the lists may appear twice.
The functions listed in the dialog are public functions.
Some add-ins use private functions. These only
available to the add-in where they are located and are not
displayed as a user defined function.
On this page we describe functions from add-ins reached
from the Add ORMM dialog and on the next page we
describe functions reached from the Add OMIE dialog.
If an add-in is not listed, it provides no useful functions.
|
| |
All the functions provided by a particular add-in
are prefaced by appropriate letters. For example all the functions
dealing with queuing have the preface "Q_" and all
the functions related to random variables have the preface
"RV_". The preface convenient because the functions
related to a particular activity appear together in the user-defined
functions dialog. The prefix is also important so that
functions have unique names. All public functions in all installed
add-ins are available to the Excel user, so to avoid confusion,
each must have a different name. The prefix is also necessary
for the add-ins that include a Relink command.
In some cases it is easy to extract a function
from its add-in by simply copying and pasting from one program
module to another. In other cases this is not so easily done
because a function may call other functions or subroutines
in the add-ins. In the discussions below we try to indicate
this.
It is important to note that when user defined
functions are placed on a worksheet, they link to the add-in
that created them. When opening a workbook that contains user-defined
functions on a different computer than the one that created
the functions, a message will appear that the worksheet contains
links and asks whether to try to re-establish the links. Answer
No to that question. Most of the add-ins have a Relink
command that rewrites all functions that appear in data forms
and all functions that begin a formula in a cell. This command
only corrects the references on the active worksheet. When
functions are imbedded in a complex formula, they will not
be corrected by the Relink command. The Link
command under the Excel Edit menu provides a reliable
but less convenient way to change the links to the resident
add-in.
|
Random Variable Functions
| |
The Random
Variables add-in has a variety of functions that
compute results regarding probability distributions and perform
Monte Carlo simulations. The functions all have the prefix
RV_. These functions are on several modules in the
add-in and they are difficult to move because they are so
large. The functions provide results for a number of named
discrete and continuous named distributions. The best way
to use them is to have the Random Variables add-in
installed.
The list of functions is shown in the dialog
above. RV_rand, RV_sim and RV_simV each return a simulated
observation of a random variable, while the others provide
moments or probability values for the distributions. Complete
descriptions are found on the pages describing the add-in.
In addition to their use in the forms constructed by the add-in,
the functions may be used independently for other applications.
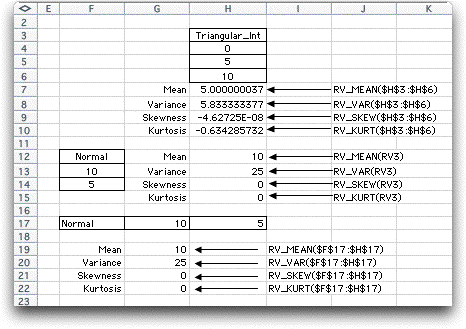
Examples appear below. Most of the functions have a range argument
that holds the name and parameters of the distribution. The
figure below shows three examples. The first involves a discrete
triangular distribution. The range consists of several cells
in a column with the first holding the distribution name. The
remaining cells hold the parameters necessary to define the
distribution. In the case of the triangular, the lower limit,
mode and upper limit are necessary, requiring three additional
cells.
The middle example involves a Normal distribution. Its name
and parameters are in the range F12:F14 that has been assigned
the name RV3. The function calls to the right use the name rather
than the explicit range definition.
The bottom example shows that the data can be arranged in a
row rather than a column. |
Queue Functions
| |
The Queue
add-in has a variety of functions that compute results concerning
Markovian and Non-Markovian queues. It is difficult to withdraw
the individual functions from the add-in, but the functions
all reside in a single module. It can be copied in its entirety
and pasted in a different workbook or add-in.
The queuing functions are all prefaced by "Q_"
or "QS_". Non-Markovian queues have the suffix "_NM".
Functions with the "QS_" prefix are used in the
queue simulation option. The user-defined functions
from the Queue add-in are shown below.
|
| |
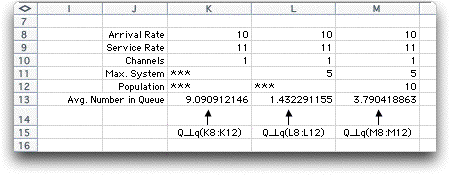
Most of the functions for queuing
have an argument which refers to the range of the data defining
the queue parameters. This range consists of three to five cells
holding in order: the arrival rate, service rate, number of
servers, maximum number in the system and population size. The
last two are optional arguments that if not specified are assumed
to be very large. The range can be arranged in either a row
or column as illustrated below. If the range has a name, the
name can be used for the argument. The add-in constructs a form
and places the queue definition range and the functions on the
form. The functions can be easily used independently to provide
queue results in any worksheet application. |

Decision Analysis Functions
| |
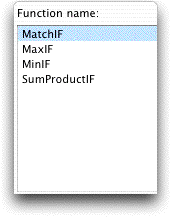
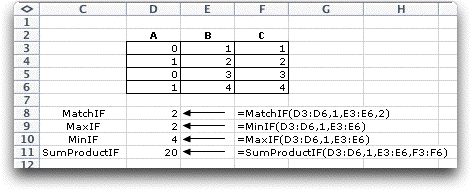
The Decision
Analysis add-in provides four functions that are
similar to Excel functions Max, Min, Match and SumProduct,
but adds a condition that identifies the cells to be included
in the operation. The functions are listed below with a definition
of their parameters. Their names do not have an identifying
prefix.
-
MinIF(A, k, B):
for the set of entries in the array A that are
equal to k, find the minimum of the corresponding
set of entries in the array B.
-
MaxIF(A, k, B):
for the set of entries in the array A that are
equal to k, find the maximum of the corresponding
set of entries in the array B.
-
MatchIF(A, k, B, m):
for the set of entries in the array A that are
equal to k, find the index of the entry in array
B whose value is the same as m. Return
the corresponding index of B.
-
SumProductIF(A, k, B,
C): for the set of entries in the
array A that are equal to k, find the
corresponding sum of the products of the elements of B
and C. Return the sum of the products.
In each case A and B (and C
for SumProductIF) are equal length arrays on the worksheet.
k and m are numbers, letters or references
to a cells. The functions are simular to the SUMIF Excel function.
The figure below shows examples of the functions.
|
Forecast Functions
| |
The functions in Forecast
can be easily extracted because they are each stand-alone.
That is, most do not call other functions. Several of them
have been included in the paj_components workbook.
The list of functions is shown below, and each
function has the prefix FF_. In most cases, range
arguments are single rows or columns.
|
|


