| |
This page describes the procedure
for adding a function to an Excel worksheet. The function is
represented on a Function Form. All the operations
of this add-in require that the function be defined in this
way. To begin, we first use the one dimensional example:
|
| |
|
To define the function, choose Add Function from
the menu. The dialog below is presented. The Function
Location holds a cell designation from the worksheet.
The function form is placed below and to the right of this
cell. The initial value is the location of the active cell
when the dialog is presented. The location may be manually
changed. The $ signs need not be included in the cell address.
The Function and Variable names are automatically
generated by the program. The names can be changed, but the
revised names must have no blanks or punctuation. A function
or variable name can be used only once in a workbook. The
number of variables is entered in the Variable Dimension box.
For the example the function has only one variable. |
|
| |
|
| |
Clicking OK places the form on
the worksheet. This is the simplest form with a single variable.
The green area in cell B3 holds the Value of the variable.
The program will vary this cell, but the user may experiment
with the value. Cells C3 and D3, outlined in maroon hold the Lower and Upper limits
of the variable and are to be set by the user. The add-in requires
finite limits for each variable. The pink cell, B4, holds the
function to be analyzed. The pink color indicates that the
user is to provide an Excel function that depends on the value
entered in cell B3. The relation between B3 and B4 may be either
direct, with references to the variables explicitly appearing
in the function, or indirect, with the function containing
references to cells outside form. At least some of these cells
must in turn depend on values of the variables.

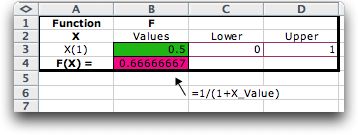
The figure below shows the form after the function
has been entered. Cell B4 now holds the function to be analyzed.
All Excel functions must begin with an "=" sign.
Excel has computed the value for x = 0.5. Note that
the function uses the term X_Value. This is an Excel
name that identifies cell B3. The name is automatically created
by the program.
In general, the computation of the function may
use many cells outside the form and be very complex. Only the
result of the final computation must be placed in the function
cell of the form. |
Cells Outside the Form |
| |
The function may depend on cells
outside the form. The second example presents a function that
is the sum of two Normal distributions. The distributions are
called curv1 and curv2. The means and standard
deviations of the functions are given in the range (B8:C9).
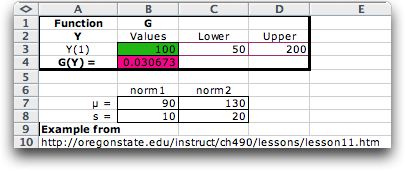
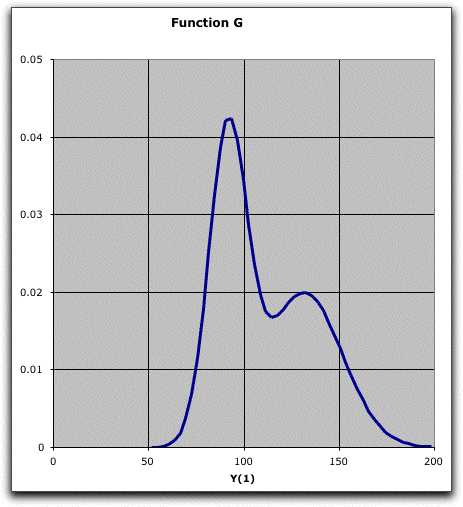
The function in cell B4 is a complex function
referring to the contents of cells outside the form. A chart
of the function constructed with the Moments command
is shown below.
Although the example illustrates function parameters outside
the form, the function call also depend on complicated calculations
performed outside the form. In fact, the value in the function
cell can depend on any number of other cells on the worksheet
that contains the function or on different worksheets in the
workbook. The only requirement is that the variables that affect
the function, their bounds, and the value of the function appear
on the form. The formula in the function cell might be a simple
link to a value in another cell. |
| |
Multidimensional Functions |
| |
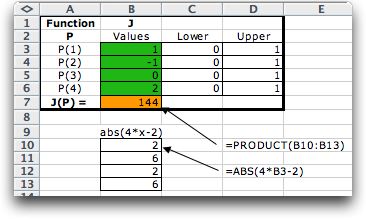
Functions that depend on more
than one decision variable are entered by specifying the number
of variables on the function dialog. The example below has four
variables.
The function's representation on the worksheet
refers to the calculations just below the function form.
There are no program restrictions on the dimensionality
of functions except for the limitations of Excel. Some of the
operations that can be performed on the function are limited
to a small number of dimensions, and problems with large dimensionality
and/or complex functions may take a very long time to solve. |
| |
Quadratic Functions |
| |
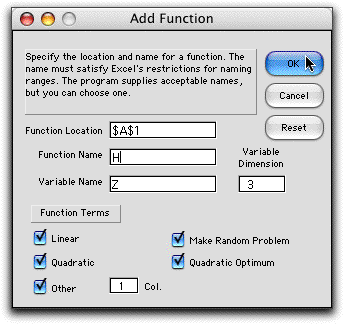
The program provides special capabilities
for describing functions that include quadratic terms. The function
dialog with the quadratic boxes checked is below. The Make
Random Problem button fills in the form with random integer
numbers. The random problem generator always creates convex
quadratic functions.
The function to be entered is:
The form has ranges for entering the parameters
of the function. Cell D6 holds the constant term, F3:F5 holds
the linear coefficient vector, and H3:J5 holds the quadratic
matrix. The example also includes cubic terms. The dialog allows
Other columns to be specified. We use 1 to indicate
one extra data column (L) and one extra function column (M).
The pink color of the cells in column M indicate that the user
may place any functions in these cells. In the example we place
the cubes of the z variables. The coefficients in column
L multiply the functions in column M.
The function value in B6 is the sum of the constant,
linear, quadratic and other terms. Also shown in the range A9:B14
is the stationary point computed with only the linear and quadratic
data. This is handy when illustrating the optimization procedures.
Further analysis would show that this solution
is the global minimum when only quadratic terms are considered
and the bounds on the variables are neglected. There is no guarantee
that the quadratic optimum will be within the variable bounds. |
| |
|
| |
All the operations of the function
add-in require that a function be entered in the manner described
on this page. This is really no limitation on the models that
can be considered since the function definition can depend on
any number of cells and relations outside the form. |
| |
|


