|
A time series is a sequence of observations
of a time varying quantity of interest. Examples are the
monthly demand for a product, the annual freshman enrollment
in a department of the university and the daily flows in
a river. Time series are important for operations research
because they are often the drivers of operations research
decision models. An inventory model requires estimates of
future demands, a course scheduling and staffing model for
the university department requires estimates of future student
inflow, and a model for providing warnings to the population
in a river basin requires estimates of river flows for the
immediate future.
The forecasting add-in provides tools for selecting a
model that describes the time series, selecting a method
for estimating the parameters of the model and using the
method to forecast future values of the time series. Models
assume that observations vary according to some probability
distribution about an underlying function of time.
Four forecasting methods are provided by the add-in: moving
average, exponential smoothing, regression and exponential
smoothing with a trend (double exponential smoothing).
The add-in builds a form that accepts data from the user
and provides functions that compute estimates of the model
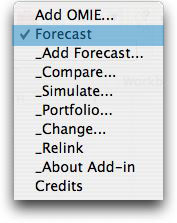
parameters. The menu installed by the forecasting add-in
gives access to several options.
- Add Forecast: This allows the user to forecast one
or more time series using one of the four methods.
- Compare: This option analyzes a single time series
with more than one method.
- Simulate: This option simulates a time series using
Monte Carlo simulation so that the response of one or
more forecasting methods can be compared. The data changes
in real time as the simulation parameters are changed.
- Portfolio: This option may have a number of time series
representing the unit values of investments and the associated
number of units owned. The add-in computes the total
value of the portfolio and forecasts of the portfolio
value.
- Change: This option provides the means to change an
existing forecast.
- Relink: When a model is prepared on one computer and
opened on another, the add-in functions will not work.
The relink command rewrites the functions to link with
the current computer. This option must be chosen
to manipulate the demonstation workbook.
- About Add-in: This option displays the author and date
of the installed version of the add-in. New versions
are placed on this web site in the Excel add-in section
as new features are added and errors are corrected.
Click a link at the left to see pages describing the several
options. |