|
|
 |
Drive/Structure |
 |
-
Pull/Tree Process
|
| |
We recognize two structure
alternatives, tree and network, and two drive alternatives, pull
and push. To find the flows in the operations of a process, the
structure of the process and the driver of the flows must be
specified. We first consider the pull/tree process. |
| |
Pull/Tree
Process

Figure 1
|
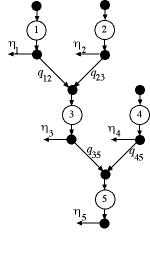
The generic pull/tree process is illustrated
in Figure 1. For this structure the flow through each
operation goes to a unique following operation, while
each operation may have several input flows from other
operations. Product is withdrawn or pulled from the operation
with the greatest index, operation 5 for the example,
in the amount  .
We usually assume that this amount is 1. In addition to the final operation of the process, our
models also allow flow to be pulled from the other operations.
These flows represent intermediate products. In general,
we identify the amount pulled from the output of operation i as  ,
the pull flow at operation i. ,
the pull flow at operation i.
For tree structures we require that the operations be
indexed so that when flow passes from operation i to
operation j, i < j. The greatest
index is m. For the example m is 5.
For the pull tree we identify the proportion,  ,
as the amount of the output of operation i required
for each unit of product passing through operation j.
The value of ,
as the amount of the output of operation i required
for each unit of product passing through operation j.
The value of  may
be any positive amount to represent a variety of manufacturing
situations. may
be any positive amount to represent a variety of manufacturing
situations. |
|
Tabular
Representation |
| |

Figure 2
|
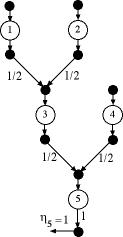
We use Fig. 2 as a numerical example.
Here we pull 1 from operation 5 and nothing from the
other operations.
For this illustration, we are assuming that 10% of the
units passing through each operation are scrapped. We also
assume proportions of 0.5 for operations 1 through 4. This
means that operation 3 receives half of its input from
each of operations 1 and 2. Further, operation 5 receives
half of its input from each of operations 3 and 4. Units
are inserted into the operations with no predecessor operations
in the amounts required to fullfill the pulled demands. |
|
| 
|
We represent the data
for the example pull tree with a two-dimensional table as illustrated
below. Here we provide only the columns necessary to show the
tree structure and compute flows. Later we add other operational
data.
| Name |
Index |
Next |
Pull
Out |
Scrap |
Group |
Proportion
|
| Op.
1 |
1 |
3 |
0 |
0.1 |
1 |
0.5 |
| Op.
2 |
2 |
3 |
0 |
0.1 |
1 |
0.5 |
| Op.
3 |
3 |
5 |
0 |
0.1 |
1 |
0.5 |
| Op.
4 |
4 |
5 |
0 |
0.1 |
1 |
0.5 |
| Op.
5 |
5 |
0 |
1 |
0.1 |
1 |
1 |
For the pull tree, an operation can send its output to no more
than one other operation, so the column labeled Next
is sufficient to describe the tree structure. The column labeled
Proportion gives the proportion of the input of the
next-operation that is obtained from the operation. The number
(0.5) in the row for Op. 1, holds the value of  . .
For the pull tree structure we define the following notation.
We use i for the general operation index.
-
 = the index of the operation following (or after) operation
i. This is the number in the Next column.
 = the flow pulled from the output of operation i.
  = the proportion of flow that is scrapped or removed at operation
i.
 = the number of items grouped at operation i.
 = the proportion of the input of operation
  that is obtained from operation i.
 = the time required for one unit to pass through operation
i. (not shown in the table)
We use the symbol a as the second subscript on  to indicate that it is the proportion of the input of the following
operation that must come from operation i. When an
operation has no following operation we assign the value 0 to
 ,
and ,
and  has no effect.
The Excel model created by the Process Flow add-in
is shown below. The add-in adds dummy operations 0 and 6. Indices
are automatically assigned by the add-in, as indicated by the
green field. The Next column represents the tree structure
of Fig. 1. The Pull Out column shows 1 unit pulled
from operation 6. We have indicated arbitrary times in the Operation
Time column. The Scrap Rate, Group Factor
and Proportion columns are filled with the data specified
for the example. |
|
| 
|
The columns
starting with J are computed using formulas inserted by the
add-in. Our purpose in this section is to provide the derivation
of these formulas for the pull/tree process. |
Scrap and Flow Removed |
| 
|
Scrap is material entering
an operation that is removed from the process. We call the associated
proportion, known as the scrap rate,  .
There are many reasons for scrap. Perhaps the operation involves
cutting a pattern from a sheet of material. The material not used
and thus discarded is the scrap. If the operation involves inspection,
the inspection procedure may discover and discard defective items.
Items discarded without further processing are scrap. This example
has scrap, but no defects, so the flow removed is entirely due
to scrap, and the Flow Removed Column is the same as
the scrap column. .
There are many reasons for scrap. Perhaps the operation involves
cutting a pattern from a sheet of material. The material not used
and thus discarded is the scrap. If the operation involves inspection,
the inspection procedure may discover and discard defective items.
Items discarded without further processing are scrap. This example
has scrap, but no defects, so the flow removed is entirely due
to scrap, and the Flow Removed Column is the same as
the scrap column. |
Grouping, Flow Removed
and Ratio |
| 
|
Consider flow passing
between a pair of adjacent operations i and j. Grouping
takes place when several items entering operation i
are grouped for subsequent processing in operation j.
This most frequently occurs in an operation just preceding an
assembly. For example, the four legs of a table may be grouped
into a single unit before assembly into a complete table. We
use the letter  to represent the grouping proportion, with 4 the appropriate
value for the table example. A grouping factor less than one
is appropriate when an item entering an operation is divided
for subsequent operations. For example, if a board is cut into
six pieces, the item entering the operation is a board and the
item leaving is a piece. For each entering item, six will leave
and the grouping proportion is 1/6.
We also use the grouping proportion to represent a change in
dimension. For example, consider operation i at which
some solid material measured in pounds enters the operation
and through some treatment is converted to a liquid material
measured in gallons. Here  would measure the transformation factor pounds per gallon.
We define the flow ratio for an operation as the ratio between
the flow leaving an operation and the flow entering. The unit
flow entering the operation is  and define the flow leaving as
  .
Then the flow ratio is: .
Then the flow ratio is:

The example shows the flow ratios in the columns
labeled Ratio (K). Since all scrap rates are 0.1 and
all grouping factors are 1, all ratios are 0.9. |
Unit Flow |
| |

Figure 3 |
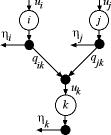
To illustrate
the computation of the unit flows we use an example with
three operations as in Fig. 3. The value of  is
entirely dependent on the pull flow withdrawn at operation i and
the amount required by the following operation k.
Since the amount required is is
entirely dependent on the pull flow withdrawn at operation i and
the amount required by the following operation k.
Since the amount required is  we
have the relation between the unit flows at i and k. we
have the relation between the unit flows at i and k.


Notice that the unit flow for an operation
depends on the unit flow of its unique following operation.
For the pull/tree process, the unit flows can be computed
recursively, starting with the  and
continuing for each operation with sequentially decreasing
operation index. The results for the example are shown
in the Unit Flow column (L) of the Excel display.
Notice the unit flow through operation 1 is 0.3429. This
means that for 1 unit of product produced at operation
5, 0.3429 units must pass through operation 1. If the scrap
rates were zero, all ratios would have been 1, and the
unit flow for operation 1 would have been entirely determined
by the proportions. The unit flow at operation 1 would
have been 0.25 in this case. and
continuing for each operation with sequentially decreasing
operation index. The results for the example are shown
in the Unit Flow column (L) of the Excel display.
Notice the unit flow through operation 1 is 0.3429. This
means that for 1 unit of product produced at operation
5, 0.3429 units must pass through operation 1. If the scrap
rates were zero, all ratios would have been 1, and the
unit flow for operation 1 would have been entirely determined
by the proportions. The unit flow at operation 1 would
have been 0.25 in this case. |
|
Unit Time |
| 
|
The time required for operation i per
unit of finished product is called the unit time and designated
 .
The unit flow for the operation tells the quantity of flow
through the operation for each unit of finished product, so
the unit time is simply the product of the operation time
and the unit flow. .
The unit flow for the operation tells the quantity of flow
through the operation for each unit of finished product, so
the unit time is simply the product of the operation time
and the unit flow.

For the example these quantities are in column
M. The sum of the operation unit time values is the total
time in the system for each unit of finished good. For a serial
system, this is the cycle time for the product. In the more
general context we call it the throughput time. This sum is
computed and stored in cell K2.
|
Operation Flow |
| 
|
The production volume for the process is designated
V is placed in cell B4 at the top of the table. This
flow is measured using the Flow Time Interval. In
this case the production volume is 100 units per week. The
unit flow for the operation tells the quantity of flow through
the operation for each unit of finished product. It is measured
using the Operation Time Interval, so the total flow
through the operation is the product of the flow ratio and
the production volume divided by the operation time interval
(40 in this case).

For the example these quantities are in column
N.
|
Work-in-Process (WIP) |
| 
|
The work-in-process
at an operation is the product of the flow rate through the
process and the residence time in the process (Little's Law).
For the example, we multiply the quantities in columns M and
N to find the WIP for each operation, shown in column O.

The sum of the operation WIP values is the average
WIP of the entire process. This sum is computed and stored in
cell K3. |
| |
|
|


