| |
In this section we consider
the push/network process. Many of the definitions and computations
associated with the various drive/structure alternatives are
the same as for the push tree. The principal changes are in the
data defining the network structure and the proportions. The
computation of the unit flows is quite different for the network
structure as compared to the tree structure. |
| |
Push/Network
Process

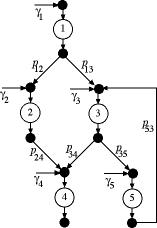
Figure 1
|
The
push/network process is illustrated in Fig. 1. For this
structure the flow through each operation may go to more
than one operation, and each operation may have several
input flows from other operations. This is a more general
structure than the push/tree process. Product is inserted
or pushed into any of the operations. We use  as
the amount pushed into operation i. We assign
the value of 1 to  .
The push flows to the other operations are given as relative
to  .
Indices are assigned to the operations arbitrarily, however,
it is often convenient to assign the indices to be increasing
in the direction of primary product flow.
For the push network we identify the proportion,  ,
as the amount of the output of operation i that
is passed to operation j for each unit of product
passing through operation i. The value of ,
as the amount of the output of operation i that
is passed to operation j for each unit of product
passing through operation i. The value of  may
be any nonnegative amount. Typically for a service system,
the sum of the proportions leaving an operation is equal
to 1. This means that the flow is split among the several
following operations. It may be necessary to use other
combinations of proportions to represent different systems. may
be any nonnegative amount. Typically for a service system,
the sum of the proportions leaving an operation is equal
to 1. This means that the flow is split among the several
following operations. It may be necessary to use other
combinations of proportions to represent different systems.
The example shows an arc passing from operation 5 back
to operation 3. In a practical instance, this might represent
the reworking of some part.  as
the proportion of the output of operation 5 returned to
operation 3. It is not necessary to define a proportion
for the flow leaving the system at operation 5. as
the proportion of the output of operation 5 returned to
operation 3. It is not necessary to define a proportion
for the flow leaving the system at operation 5.
|
|
Tabular
and Matrix Representation |
| |

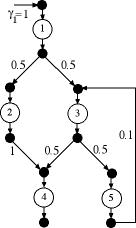
Figure 2
|
We use Fig. 2 as a numerical example.
Here we push 1 unit into operation 1 and nothing into
the other operations.
Although we can represent much of the data for a push
network with a two-dimensional table as illustrated for
the example below, it is necessary to represent the proportions
on a square matrix. We call this the proportion matrix P.
Notice that we have left out both the Previous and Proportion columns
from the table since the following preceding operation
is not unique for the network. The matrix P describes
both preceding operations and proportions.
For the example, we assume zero scrap rates and grouping
factors equal to 1. |
|
| 
|
| Name |
Index |
Push
In |
Scrap |
Group |
| Op.
1 |
1 |
1 |
0 |
1 |
| Op.
2 |
2 |
0 |
0 |
1 |
| Op.
3 |
3 |
0 |
0 |
1 |
| Op.
4 |
4 |
0 |
0 |
1 |
| Op.
5 |
5 |
0 |
0 |
1 |
For the push network structure we define the following notation.
We use i for the general operation index.
 = the flow pushed into operation i.
  = the proportion of flow that is scrapped or removed at operation
i.
 = the number of items grouped at operation i.
 = the proportion of the output of operation i that
is sent to operation j.
 = the time required for one unit to pass through operation
i. (not shown in the table)
For the network, flow may pass from an operation to any other
operation, so a matrix is required to describe the proportion
information. We call the matrix P. In general

For the case of the example:

The Excel model created by the Process Flow add-in
is shown below. The add-in adds dummy operations 0 and 6. Indices
are automatically assigned by the add-in, as indicated by the
green field. The Previous column is not required. The
Push In column shows 1 unit pushed into operation 1.
We have indicated arbitrary times in the Operation Time
column. Since the Scrap Rate and Group Factor
are 0 and 1 respectively, we have not included their columns.
No Proportion column is necessary for a network. |
| |
| 
|
The structure
and proportions are described by the P matrix
(Transfer Out matrix). This matrix is on the left of
the figure below and includes the dummy operations 0 and 6.
The matrix on the right is called the Augmented Matrix.
Proportion data is entered in the P matrix,
and the Augmented Matrix is determined by Excel formulas. The
two matrices are constructed on the same rows of the Excel worksheet
as the tabular data for the process. |
|
Scrap and Flow Removed |
| |
These features take the
default values, 0 and 1, respectively. They do not affect the
analysis. Nontrivial values would be handled in the same way
as the push/tree structure. |
Grouping, Flow Removed
and Flow Ratio |
| 
|
The general expression
for the flow ratio is:

Using the example parameters all ratios are 1,
as shown in column F. The column designations provided in this
discussion (F) refer to the example worksheet above. The column
designations for a different instance will depend on the location
of the process on the worksheet. |
Unit Flow |
| |

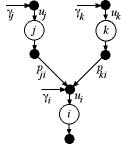
Figure 3 |
To illustrate
the computation of the unit flows we use an example with
three operations as in Fig. 3. The value of  ,
the input flow to operation i depends on the push
flow at operation i and the amounts provided by
the preceding operations, j and k. ,
the input flow to operation i depends on the push
flow at operation i and the amounts provided by
the preceding operations, j and k.

We write the equations entirely in terms
of the unit flows by using the flow ratios.

This generalizes to the expression that
must hold for each operation.

We define the augmented proportion matrix as

Also define the column vector u of
unit flows. Then the unit flows are the solution to the
linear set of equations:

The T superscript indicates the matrix transpose
operation.
For the example, the matrices are:

Note that the proportions leaving operation i are
described by row i of the P matrix.
Solving for the unit flows we find:

The unit flow vector is computed using Excel
matrix operations and is shown in column G of the example
worksheet. |
|
Unit Time |
| 
|
The time required for operation i per
unit of finished product is called the unit time and designated
 . .

This computation is the same for all drive/structure
alternatives and is stored for the example in Column H. The
sum of the unit times is the Throughput time.
It is computed and stored in cell K44.
|
Operation Flow |
| 
|
Again, this computation is the same for all
drive/structure alternatives. The illustration assumes there
the operating inverval is hours and the demand interval is
weeks with 40 hours used per week.

The value of V is from cell B46 in
the example. The denominator of the expression depends on
the time units selected for the demand and operation intervals.
It is entered in cell G45. The computed values are placed
in column I of the worksheet.
|
Work-in-Process (WIP) |
| 
|
This computation is
the same for all drive/structure alternatives.

The sum of operation WIP values is computed and
stored in cell K45. |
| |
|


