 |
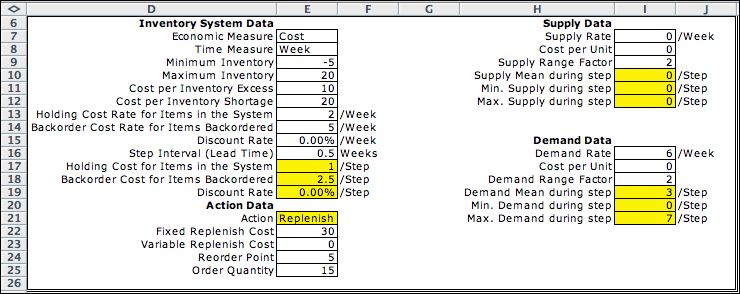
The data
for the DTMC is similar to the MDP data except that this model
is not an optimization model. The reorder point and lot size
(order quantity) are specified in cells E24 and E25. The DTMC
finds the costs and state probabilities associated with the
given solution.

 |
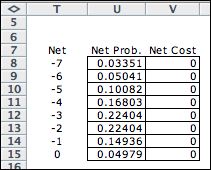
The probability distribution
for demand is evaluated by the Poisson distribution. |
|
The Model |
|
The DTMC model consists of the
state and event elements. These are the same as the MDP. |
|
| |
The first transition block is effective for a
replenishment. The reorder point is the maximum state value in
F37. The order quantity is linked to the Data worksheet with
a formula in cell S35. |
Lists |
| |
The state and event lists are the same as the
MDP lists. |
| |
|
| |
 |
Combining states with events result
in 208 transitions. |
|
Steady State Solution from DP Solver |
| |
The Solver model for the DTMC does not show
the actions explicitly. The purpose of the solution is to evaluate
the steady-state probability distribution and the state values.
The result shows an average cost of operating the inventory
of approximately 16.0 per step.
The DTMC model can also be solved with the Markov Analysis
add-in. The same answers were determined by the steady-state
analysis with that add-in. |
| |
|
Summary |
| |
The DTMC model is quite similar to the MDP
model except it does not include the action element. The average
cost step for the DTMC model is greater than the same measure
for the MDP model. This is not surprising because the MDP optimizes
the reorder point and order quantity, while the DTMC does not. |
| |
|


