|
|
 |
Facility
Layout |
 |
-Defining
the Facility |
| |
The
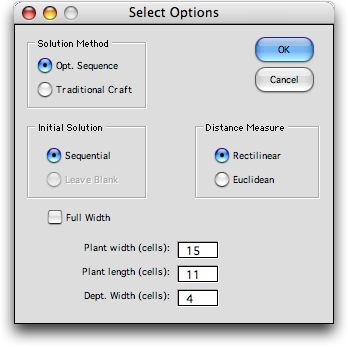
button on the Layout Data worksheet presents the dialog
box shown below with which the various solution options
are selected. The distance between two departments is the
distance between their respective centroids. When
material movement is parallel to the length and width boundaries
of the plant, it is reasonable to use the rectilinear measure.
When the movement is via straight lines between the two
centroids, the Euclidean measure is appropriate. Two
solution options are available, the Optimum Sequence method
and the Traditional Craft. We first discuss the Optimum
Sequence method. The length and width of the plant and the
aisle width are set in the fields at the bottom. |
| |
|
| |
The
facility layout worksheet has various parameters and options
listed at the top of the page as illustrated below. The cells
on this worksheet that are colored yellow hold either formulas
or data controlled by the program, so they should not be manually
changed. The worksheet name should not be changed.
At the top of the page in column B we
see the name, number of departments, length and width of the
facility, total area and the cost for the current layout (shown
in the next figure). We hope to find a layout that minimizes
the cost in cell B8. Column E holds parameters that are described
subsequently.
Starting in row 11, a row is provided
for each department. Column A holds the department name,
column B holds its color, column C holds the area defined
on the Layout Data worksheet, column D holds the area defined
for the department on the current layout. Columns E and
F hold the computed centroids of the department. For this
example, we are using an Aisle
layout. Column G shows the sequence number of the department. The
ranges shown in green hold numbers computed by the program. |
|
|
|
When
the Sequential button is selected for the initial solution,
a layout is automatically generated with the departments listed
in numerical order in column G. This is the default initial
sequence, but the numbers in this column can be changed to accommodate
a user-supplied initial sequence. This is important if some
departments are given a fixed index in the sequence.
The Leave Blank option is available
only with traditional craft. Here the layout is left blank initially
and the user must manually define the department locations in
the layout. The layout is immediately to the right of this data
on the worksheet.
The initial layout for the example was
generated with the default sequence using an Aisle layout and
is shown below. |
| |
|
| |
The layout starts
in cell J11. The number of colored cells to the right of J11
is the width of the facility and the number of colored cells
below J11 is its length. The locations of the departments are
specified by department indices or colors. The initial layout
can be entered manually or automatically. It is most convenient
to use an automatic Aisle layout. The aisles are indicated
by the white lines running through the centers of the departments.
This layout form is often associated with the ALDEP layout construction
procedure.
The aisle layout is determined by the
department width, which for the example is equal to 5, and the
sequence of departments. For the example we have chosen the
sequence as the department indices. The first department in
the sequence starts in cell J11 and is assigned cells to the
right until the department area is completely defined or the
department width is reached. For the example, department 1 requires
all five cells. The second department is placed below the first,
using as many rows as necessary to enter the entire area. We
continue to add departments until the entire length of the facility
is used. Then the departments are placed at the bottom of aisle
2. In the example, department 4 uses both aisles 1 and 2. The
layout continues up aisle 2 until the top is reached for department
8. The the layout proceeds down aisle 3 until all departments
are placed. For the example, five cells remain unused. The white
lines on the layout show the serpentine nature of this layout
procedure.
To illustrate the effect of a different
department width we click the Change button. The dialog
below is presented. Any of the options may be changed
by clicking a button or changing the fields defining the width
and length of the plant and the depth of an aisle. In this
case we change the depth to 4.

Because the department areas are not
multiples of 4, the layout becomes more irregular. This affects
that accuracy of distance measurements since department centroids
are no longer in the center of rectangular departments. |
| |
|
| |
An
alternative layout that more nearly maintains rectangular departments
is obtained when the Full Width box is checked. The
result for the example is shown below. For this option, departments
are increased in area so that they fill an integral number of
rows of the layout. Note that the area of department 1 has increased
from 5 to 8. Of course, when department areas are increased,
it may be necessary to increase the size of the facility. This
is the case for the example where it is necessary to increase
the length of the facility to 12 so that the larger departments
can be accommodated. |
| |
|
| |
The next step is to
search for the optimum layout. We consider first the Optimum
Sequence method and then the Traditional Craft method
on the following pages. |
| |
|
|


