| |
For more extensive searches for
the optimum of a sequential layout we use the capabilities of
the Optimize
add-in. To use the methods described on this page the Optimize
add-in must be installed. When the sequential layout worksheet
is created, two additional buttons are placed above the graphical
display of the layout. The Optimize Form button, shown
in column O of the figure below, constructs a form used for
the combinatorial search process and creates the necessary links
between the form and the layout data. The Optimize
button, in column T, calls the dialog that sets the parameters
for a combinatorial search and initiates the search.
We use the example described earlier
for illustration. The initial layout below has the departments
sequenced in numerical order. |
| |
|
| |
Clicking
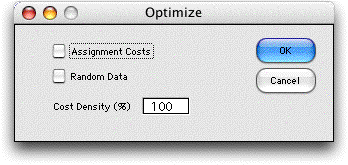
the Optimize Form button brings a dialog that controls
whether the model includes assignment costs and restrictions
or not. For this example we choose to not include the assignment
costs and illustrate the other option later.

Clicking the OK button creates the form
shown below at the right of the layout. The form shows the initial
permutation describing the layout. Rows 3 through 5 hold information
used by the search procedure. Cell AL has a link to Cell B8,
where the computed value of the layout is calculated. The range
of cells AJ8 through AS8 are manipulated by the search algorithms.
They are linked by Excel formulas to the range G11 through G20,
the cells that define the sequence for the Layout add-in. The
cells in row 10 are constructed by the Optimize add-in but are
not used when assignment costs are not considered. The Feasibility
conditions defined by cells AN3 and AN4 are not used for
the example. |
| |
|
| |
Clicking
the Optimize button presents the Search dialog
with various options for searching for the optimum permutation
and the associated layout. For the illustration we have chosen
to randomly generate 10 permutations or layout sequences. Notice
that the form does not allow a Greedy solution. We
have disabled this button because the algorithm of the Optimize
add-in used for the greedy solution of permutations does not
work for the layout application. |
| |
|
| |
The Optimize add-in
generates 10 random permutations and the Layout add-in
evaluates them. The best of the 10 are placed on the combinatorial
form. The 10 solutions appear to the right of this display (shown
below the form on this page). |
| |
|
| |
|
| |
The
layout associated with the best of the solutions is shown below.
It happens that this solution is not as good as the initial
solution. |
| |
|
| |
We
continue in our search for the optimum by starting from the
best random result and choosing the improvement option that
tries all 2 and 3-change variations of the layout. The process
first tries all 2-change variations and whenever a change results
an improvement, the two permutation positions are switched in
value. The process continues until no 2-change switch results
in improvement, then all 3-change switches are evaluated. The
program terminates when a complete run through the changes results
in no improvement. |
| |
|
| |
The
results are shown below. The layout measure has been improved,
but there is no guarantee that the solution is optimal. Along
with the results, the improving solutions encountered during
the search are listed starting in column AU. The best solution
is repeated as run 381. The time required for the 381 evaluations
was 28 seconds on the author's computer. Each evaluation requires
a call to the subroutine eval_layoutcomb in the Layout
add-in. Each evaluation requires significant computation effort.
|
| |
|
| |
|
| |
The
final layout with the interdepartmental flows superimposed is
shown below. |
| |
|
| |
We
see on the worksheet starting in column A, various quantities
used in the evaluation. When the combinatorial search procedures
are in control, the sequence defining the layout in column G
is controlled by the the combinatorial algorithms. For example,
cell G11 holds the formula
=$AJ$8
The value in cell AJ8 is the first element of
the permutation. The other cells in column G are similarly linked
to the combinatorial variables. |
| |
|
| |
The
combinatorial procedures of the Optimize add-in are much more
powerful than the random search and 2-way switches available
in the Layout add-in. There are limitations to the Optimize
search however. Only the Sequential layout is
defined by a permutation, so the option is not available for
the Traditional layout.
The combinatorial form (cells AN3 and
AN4) allows feasibility conditions on permutations. These are
not used for the example, but the feasibility conditions might
be useful for other layout applications. |
Assignment Costs and Restrictions |
| |
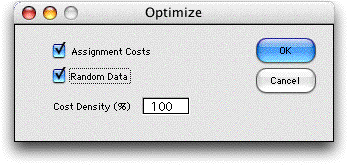
Clicking
the Optimize Form button brings a dialog that controls
whether the model includes assignment costs and restrictions.
We consider the same example as above, but decide to include
assignment costs. The Random data button indicates
whether the program is to provide random data for the costs.
The Cost Density indicates the proportion of cells
that are to contain numeric cost data. The alternative is for
a cell to contain the string ***. This indicates that an assignment
is not allowed.

The figure below shows the portion of the worksheet
containing the combinatorial form after 10 random solutions
were generated and the best of these improved with 2-change
assignment swaps. The assignment cost matrix is labeled C(i,
j). A component in column j and row i indicates the cost of
assigning department j to sequence position i. To illustrate
the possibly fixed assignments, disallowed assignments are indicated
by *** in the associated cells. The example illustrates the
case where department 1 is fixed as the first department in
the sequence and department 10 is fixed as the last. Department
5 is required to have an even numbered position. Disallowed
cells reduce the search effort because solutions that use disallowed
cells are not enumerated.
The assignment costs are computed in row 10 and
the sum is added to the layout cost in cell AL5. The combinatorial
optimization minimizes this sum. |
|
| |
The form below shows several
solutions found during the improvement process. Run 1 in row 17
holds the best solution obtained in 10 randomly generated solutions.
During the improvement process only solutions that result in an
improvement in the incumbent solution are included in the solutions
presented. The best solution is solved as the final run, so two
identical solutions appear at the top of the sorted list. |
|
| |
The final layout is shown
below. |
|
| |
It must be emphasized
that the search processes provided by the Optimize add-in
do not guarantee optimality. They do provide a method to find
good solutions to hard problems. Using the random generation
plus improvement options and few hours of computation time,
one can probably find good answers to problems of moderate size.
The effort to evaluate an individual layout grows approximately
as the square of the number of departments and linearly with
the number of cells in the layout. The effort of generating
random solutions is approximately linear with the number of
solutions generated. The effort of one pass through the 2-change
improvement process is approximately quadratic with the number
of departments. The number of passes through the process is
hard to estimate, but one would also expect that to grow with
the number of departments. The number of solutions evaluated
for exhaustive enumeration grows exponentially with the number
of departments.
With these rough estimates, one could try exhaustive enumeration
with up to 10 departments. From 10 -30 departments the various
heuristics probably would yield results in reasonable time.
With more than 30 departments, quadratic growth begins to become
painful. With more than 30 departments, the cost of a commercial
solver or programming a stand alone application in an efficient
programming language is probably justified. The Excel worksheet
can probably hold a problem with 100 departments, but computation
would be painfully slow. |
|


