| |
The
sequential layout is defined by the department width and the
sequence used to layout the departments along the aisles of
the facility. The optimum sequence method of solution
starts with an arbitrary initial sequential solution and tries
to improve the layout by switching two departments in the sequence.
At each step, the method computes the cost changes for all possible
switches of two departments and chooses the most effective pair.
The two departments are switched in the sequence and the method
repeats. The process stops when no switch results in a reduced
cost. To illustrate we start with the departments sequenced
in order of department index as below. |
| |
|
| |
Clicking
the Solve button presents the dialog below. The top
button stops at each iteration to show the new layout. The second
button stops when there is no further improvement. |
| |
|
| |
Starting
from the initial sequence, the program finds the best switch
and presents its conclusion below. |
| |
|
| |
Clicking Yes
causes the change in layout. Notice that departments 9 and 10
are switched in sequence and in location. |
| |
|
| |
The
next best switch is departments 1 and 3. Notice that the change
in sequence affects the relative locations of the departments
switched. When the departments are of different size, the locations
of all departments between are also adjusted. |
| |
|
| |
We
restarted the process with the initial sequence and chose the
Do Not Stop option. The process stopped with no further
improvement after one additional switch of departments 6 and
7. The result is shown below. |
| |
|
| |
To
the right of the layout appears a summary of the switches made
during the process. |
| |
|
| |
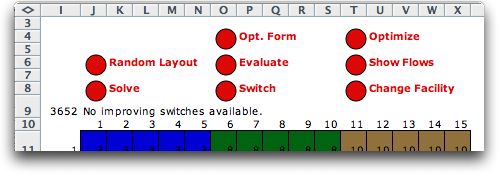
Above
the layout there are several additional buttons. The Random
Layout button generates a random sequence of departments
and places them on the layout. Since the switch heuristic does
not guarantee optimality, it is useful to start at several different
solutions and select the best.

The Evaluate button evaluates
the current sequence placed in column G of the worksheet.
The user can manually change the sequence. The Switch button
allows the user to force the program to switch two departments.
The Change Facility button allows the user to change
features of the facility, such as length, width or department
width, or change the solution options. The Show Flows
button draws lines between centroids to show the flows. We
discuss the Opt. Form and Optimize buttons
later. |
| |
For
the example we generated a random sequence using the Random
Layout button and performed the switch procedure until no
improvement was possible. The resulting layout is shown below
with the summary results. Note that this layout is much different
that the one previously discovered. Its cost is slightly larger
than before. |
| |
|
| |
|
| |
We
initiated the layout with a department width of 4 with the resultant
sequential layout as below. |
| |
|
| |
After
a sequence of switches we obtain the final layout shown with
its summary below. |
| |
|
| |
|
| |
Clicking
the Show Flows button shows the flow lines between
departmental centroids. The thickness of a line shows the relative
magnitude of the flow-cost between two of the departments. Four
different thickness are used with a thin line indicating a relative
small flow-cost between two departments and a thick line indicating
a large flow-cost. |
| |
|
| |
The sequential layout
can be easily automatically generated. The sequential layout
method quickly finds good layouts for alternative facility designs.
The Traditional Craft method is an alternative. It
is described on the next page.
|
| |
|


