| |
It may be that several
products are constructed using common subassemblies. We have
adapted the add-in to recognize subassemblies as raw materials.
This may reduce substantially the data required for some systems.
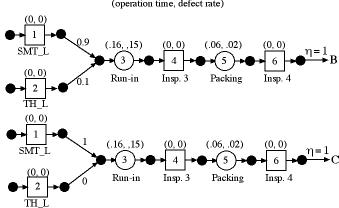
To illustrate we consider product A used earlier for illustration.
The product receives its inputs from two separate manufacturing
lines, the SMT line and the TH line. The process is shown below.

Since products B and C are the same as product
A except receiving different proportions of inputs from the
two lines, it may be more efficient to describe the processes
as below. Here we have identified a new SMT product and a new
TH product. These are subassemblies that are inputs to operations
1 and 2 respectively in the product A process. We use SMT and
TH as the product names. We use SMT_L and TH_L to identify the
process resources.


Products B and C differ only in the proportions
coming from the two lines.

It is more convenient to represent the
system as a collection of subassemblies because the details
the SMT and TH lines need not be repeated. |
Defining the Subassemblies |
| |
The figure below shows the Excel worksheet
describing process A. Note that operations 1 and 2 link to
the SMT and TH subassemblies. The link is provided by the
names in column K. The subassemblies SMT and TH are listed
as the raw materials for the first two operations.
|
| |
|
| |
The portion of the worksheet defining
the SMT and TH subassemblies appears below. The flows through
the subassemblies are not automatically linked to the processes
defined for A, B and C. Linking equations could be placed
in cells B49 and B60, however, the program does not provide
them. The linking occurs on the Project worksheet.
|
| |
|
| |
The definitions for B and C also use
SMT and TH as raw materials.
|
| |
|
| |
|
Project Worksheet |
| |
Selecting the Process Economics
item from the OM/IE menu, creates the Project worksheet.
It is similar to the worksheet without subassemblies, however,
new features are added to link the processes to the subassemblies.
We see in the Product portion of the worksheet the
table describing the economics of production. The contents
are driven by the Sales entered in column I, 200,
500 and 1000, for products A, B and C respectively. Note that
SMT and TH have no sales. Column J, however, shows the production
of these subassemblies that are required by their inclusion
in the three primary products. Column J is computed from the
Assembly matrix starting in column O. The assembly matrix
is constructed by the add-in from data defining the processes.
Column K shows the sum of the resource
operation cost and raw material cost for each product. For
products A, B and C, however, this cost does not include the
cost of the subassemblies. Column L computes the total cost
including subassemblies. Column M is the net operating profit
computed as the unit revenue less the unit total cost.
|
|
| |
Further down the Project worksheet
we find the matrices defining material and resource use. Note
that SMT and TH are listed both as materials and products
in these matrices.
|
| |
|
Mathematical
Programming Models |
| |
The mathematical programming models
must have additional variables and additional constraints
to represent the link between products and subassemblies.
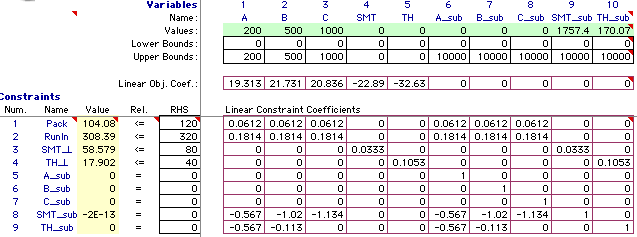
The product mix model is shown below. An additional variable
is provided to allow each product to also act as a subassembly.
There is also an additional constraint for each product to
link sales to subassembly use. The solution shows the optimum
sales of each of the products and the associated subassembly
requirements.
The other mathematical programming models
are adjusted in a similar manner.
|
 |
| |
Whenever
one or more products is listed as a raw material, the add-in
adjusts the analysis and mathematical programming worksheets
as indicated on this page. When no products appear as raw materials,
the subassembly adjustments are not made. |
| |
|


