|
|
 |
Process
Flow Analysis |
 |
-
Computation for Flow Analysis |
| |
Spreadsheet formulas are included to compute
a number of characteristics associated with the process. We repeat
the data for the example together the results. The descriptions
of the results columns follow. All of the cells in the analysis
columns are colored yellow on the worksheet. The colored cells
indicate that the cells contain formulas that should not be changed
by the user. Some of the cells use functions defined by the add-in.
If a model is created on one computer and opened on another, these
functions will not compute. Use the Refresh Functions command
to rewrite the functions. Not all the results column are shown
in this example. We describe all the result columns below using
the Excel column letter for identification. |
| |
|
| |
Results
for the Process Analysis Example
Column |
Title |
Explanation |
M |
Defects
Out |
For a processing operation ("Op"),
this is the proportion of the items leaving an operation
that have defects. We assume that the defect
producing mechanisms in different operations are independent.
The function in this cell combines the probabilities
of defective parts entering the operation with the
defect probability for the operation to obtain the
probability that an item leaving the operation is defective.
The computations are implemented in the defect user-defined
function.
For an inspection operation ("In"), the
probability of a defective part leaving is zero if
the inspection is perfect, that is inspections find
and remove all defective items. If the inspection is
not perfect, the function computes the probability
that a defective item leaves the inspection.
|
N |
Flow
Removed |
For a processing operation, this
cell contains the adjusted scrap rate for the operation.
When the operation is an inspection, defective items
are removed as waste. The proportion discarded is shown
in this column. Again, these cells are computed with
a function, remove1, provided by the
add-in.
|
O |
Ratio |
This is the ratio between output
flow and input flow for an operation. When material
is removed, the ratio is less than 1 as in the example.
The ratio is also affected by the grouping factor for
the operation.
|
P |
Unit
Flow |
For this example, this is the
flow into the operation per unit flow out of the process
(out of operation 9). In general for a pull
system, there may be several operations from which
flow is removed as described by the pull out column
of the data. The unit flow is the effect of the combined
output flows from the process.
For the pull tree structure these cells are
computed with an algebraic formula based on the unit
flow of the next cell and the ratio and proportion for
the operation. For a pull network structure
the unit flows are computed with a matrix computation
using the Excel matrix inverse function.
|
Q |
Unit
Time |
This is the resource
(machine) time used by this operation per unit
of the flow out from operation 9. For the example
this is just the time used by a unit of product A.
|
R |
Operation
Flow |
This is the total flow rate into
the operation. It is the Unit Flow multiplied by the flow
out. For product A the flow out is in cell B4. The
Operation Flow is this output flow divided by the number
of operating hours per week that appears in cell G3 multiplied
by the Unit Flow.
|
S |
WIP |
This is the flow rate through the
operation multiplied by the residence time in the operation.
It is the operation flow (flow rate) multiplied
by the operation time (residence time) .
By Little's law, this must be the average work-in-process
that resides at the operation, or
the WIP.
|
|
| |
In column K near the top of the display
we see two computed quantities. Cell K3 computes the total
WIP in the process. It is the sum of the operation WIP values
appearing in column S of the process display. Cell K2 holds
the total WIP divided by the total flow rate out of the process.
For the Pull system, the total flow rate out of the process
is the sum of the external flows from column E of the data
multiplied by the contents of cell B4. When the operations
are arranged in a series system it is the average time interval
between when raw materials enter the process and when the
finished good leaves the process. Sometimes we call this the
cycle time. When the structure is more general than a series
system, it is the average time materials remain in the system.
|
| |
|
| |
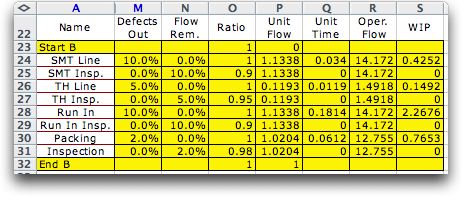
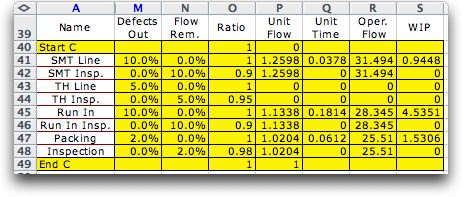
The process results for products B
and C are below.
|
| |
Results
for Process B

Results for Process C

|
| |
|
|


