Product Information
|

Range |
Title |
Explanation |
E3:E5 |
Product |
These cells hold the names of the processes. We
associate the output of each product with the process.
The name of the product is the name of the process.
These names are compiled from the process names in
the workbook. They should not be changed. |
F3:F5 |
Unit
Revenue |
This is the revenue
realized per unit of sales for each products. |
G3:G5 |
Min
Sales |
This is the minimum
number of units sold per week for each product. |
H3:H5 |
Max
Sales |
This is the maximum
number of units sold per week for each product. |
I3:I5 |
Sales |
This is the number
of units sold per week for each product. The user
may experiment with these values. The specific
values shown here are those provided by the flow
out entries for the products. When a mathematical
programming model is constructed and run the computed
results will replace these entries. In that case
the range will be colored yellow. |
J3:J5 |
Unit Operating/Raw
Material Cost |
This is the sum of the unit
operating cost for the resources used by the process
and the cost of the raw materials expended for
a unit of product. |
K3:K5 |
Unit
Profit |
This is a computed
number that is the unit revenue minus the raw material
and resource costs for a unit of product. |
|

Resource Availability Information
|

Range |
Title |
Explanation |
E9:E12 |
Resource |
These cells hold the names
of the resources. The add-in compiles a list of
resources from those named in the Resource
Type columns of the processes. General resources
also are included in this list. The list is compiled
by the add-in and should not be changed. |
F9:F12 |
Number
Used |
This is
the actual number of resources (machines) used
of each type. |
G9:G12 |
Max Number |
This is the maximum number
of resources (machines) that can be used. |
H9HI12 |
Unit
hours/week |
This is the number
of hours each machine type is available during
a week. The number 40 indicates one 8-hour shift
per day and a five day week. Two shifts per day
would be indicated with 80 in this cell. |
I9:I12 |
%
Available |
This is the percent
of time each machine is available for productive
activities. The number might be less than 100%
due to downtime for maintenance, worker break times,
etc. |
J9:J12 |
%
Maximum Utilization |
This is the percentage
of the available time that the machine is to be
active. This number might be set less than 100%
to allow for statistical variability. |
K9:K12 |
Unit
Available hours per week |
This is a computed
field that indicates the maximum number of hours
one unit of a machine type can be used during a
week. It is the product of the previous three columns. |
L9:L12 |
Max. Available
hours per week |
These entries multiply the Max.
Number by the Unit Availability. |
M9:M12 |
Resource
Available hours per week |
These entries multiply the Number
Used by the Unit Availability. |
N9:N12 |
Resource
Used hours per week |
This is the numbers of hours
used on each resource type for the specified level
of sales (I3:I5). For the example, the time used
on Run-In is more than the amount available.
This is clearly a bottleneck resource. When the
time used is greater than the time available, the
sales quantities are not feasible. |
O9:O12 |
Utilization |
This is the proportion of
the time available that the resource is used. It
is the entry in row N divided by the amount in
row M. |
|
Resource Space Information
|

Range |
Title |
Explanation |
E16:E19 |
Resource |
These cells hold the names
of the resources. The add-in compiles a list of resources
from those named in the Resource Type columns
of the processes. General resources also are included
in this list. The list is compiled by the add-in
and should not be changed. |
F16:F19 |
Space
per Unit |
This
is space measured in some squared space dimension.
The data is useful for a plant layout analysis. |
G16:G19 |
Operating Cost
per hour |
This is the cost to operate
the resource per hour. |
H16:H19 |
Investment
Cost per week |
This is the investment cost
per week. It is used when the number of machines
is to be optimized. The time dimension for the operating
cost and investment cost are the same. |
I16:I19 |
Space
Required |
This
is computed by multiplying the Space per Unit by
the Number Used (F9:F12). |
J16:J19 |
Operating
Cost per Week |
This is computed
by multiplying the Operating
Cost per Hour by the Resource
Used (N9:N12). |
K16:K19 |
Investment
Cost per Week |
This is computed
by multiplying the Investment
Cost per Week by the Number
Used (F9:F12). |
|
|

Range |
Title |
Explanation |
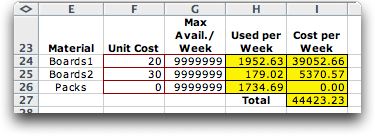
E24:E26 |
Material |
These cells hold the names of the materials. The
add-in compiles a list of materials from those named
in the Raw Materials Type columns of the processes.
General raw materials also are included in this list.
The list is compiled by the add-in and should not
be changed. |
F24:F26 |
Unit
Cost |
This is the unit cost for purchasing
the raw materials. |
G24:G26 |
Maximum Available |
This is the maximum number of units of raw materials
available per week. |
H24:H26 |
Used |
This is the numbers of units used for each raw
material type for the specified level of sales (I3:I5). |
I24:I26 |
Cost |
This
is computed by multiplying the Space per Unit by
the Number Used (F9:F12). |
|
|
This
information is produced entirely by the computer from
the process definitions. No data is entered by the user.
The entries from the Unit Resource Use matrix
come from the unit time columns of the process
definitions. When a process uses a resource more than
once, the unit times are added. The entries from the Unit
Resource Flow matrix come from the unit flow columns
of the process definitions. When a process uses a resource
more than once, the unit flows are added.

Range |
Title |
Explanation |
F31:H34 |
Unit
Resource Use |
This
is the number of hours required for on each resource
for each unit of finished good for a process. |
F35:H35 |
Resource
Operating cost per unit |
This
is operating cost associated with each resource
type per unit of product. It is included in the
unit profit computation. |
K31:M34 |
Unit
Resource Flow |
This is the
number of arrivals at each resource for each unit
of finished good for a process. |
|
|
This
information is produced entirely by the computer from
the process definitions. No data is entered by the user.
The entries come from the raw material amount and
the unit flow columns of the process results.
When a process uses a resource more than once, the results
are added.

Range |
Title |
Explanation |
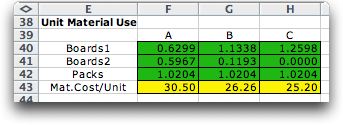
F40:H42 |
Material
used per unit of product |
This
is the number of units of raw material required for
per unit of flow out for each process. |
F43:H43 |
Material
cost per unit |
This
is material cost associated with per unit of product.
It is included in the unit profit computation. |
|
From-To
Matrix
|
The
from-to matrix accumulates flows between adjacent resources
in the process definitions. The matrix is useful for
plant layout analyses. In order for an entry to appear
there must be resources defined for each of two adjacent
operations. If adjacent operations have the same name,
the flows are not accumulated. Thus we have zero flows
on the diagonal. The flow is the sum of the flows for
all three products. The Run-in resource is specified
for the Run-in operation and flow enters this operation
from both the SMT and TH Lines. We see these entries
in the column labeled RunIn.

|
Summary Information
|
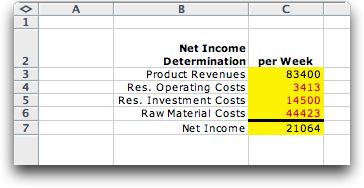
Information
on the upper left corner of the Project worksheet shows
the components of net income for the sales volumes specified.

|
|
Below
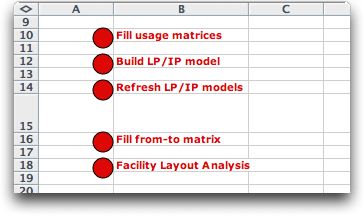
the summary information, we see four buttons that control
the computations of the add-in.

The top button fills the resource and raw material usage
matrices on the Project worksheet. These matrices are
filled when the worksheet is first constructed, but when
the user changes the definitions of the projects the
entries should be recomputed. If the sets of products,
resources or raw materials has changed, it is necessary
to completely reconstruct the Project worksheet. Economic
data previously entered is transferred to the new worksheet.
The second button creates a worksheet defining one
of three mathematical programming models that can be
used for product mix, raw material and resource decisions.
The models are discussed elsewhere in
these pages.
The third button refreshes the LP/IP models that are
in the workbook. These models depend on the economic
and process flow data and when this data is changed,
the models should be refreshed.
The fourth button fills the From-To matrix. Again this
only necessary when the data changes.
The bottom button calls the Facility
Layout add-in and places the space and flow data
into the layout data ranges.
|
|


