|
|
|
|
Inventory
Theory
|
 |
-
Deterministic/Shortages Backordered/Infinite
Replenishment
|
| |
 |
We consider again
an independent inventory with infinite replenishment rate. In
this section we allow shortages. That is, we allow the inventory
to run out and customers who arrive and find the inventory empty
do not receive immediate satisfaction. The unsatisfied customers
will respond in one of four ways.
- The customer will wait for delivery until the next replenishment
but there is a cost associated with waiting that is proportional
to the waiting time. This is called the backorder case.
- There is a fixed charge that occurs whenever the event of
shortage occurs during a cycle. The charge is independent
of the number of shortages that occur.
- The customer will wait for delivery until the next replenishment
but there is a cost associated with dissatisfaction that is
a constant, independent of the waiting time. This is called
the fixed shortage cost case.
- The customer will not accept delivery at any future time
and the sale is lost. This is called the lost sales case.
The first three cases involve backordered shortages, while
the last involves lost sales. We consider the backorder cases
on this page. |
Infinite Replenishment Rate with Shortages Backordered |
| |
The deterministic
model considered in this section allows shortages to be backordered.
This means that when the inventory is empty and additional
demand occurs, customers will wait for delivery until the next
inventory replenishment. During that time, a charge is incurred
proportional to the time the customer must wait until delivery.
The situation is illustrated in the figure below. The figure
shows inventory position. When the inventory position
is positive, the inventory position is the same as the on-hand
inventory level (inventory available for immediate delivery).
When the inventory position is negative the shortage amount
is the negative of the inventory position. The maximum inventory
position occurs when the inventory replenished. Continuous
demand reduces the inventory linearly, until it is 0. This
interval is indicated by the blue area. Additional demand results
in a shortage indicated by the red area. The replenishment
amount is q and is the difference between the maximum
and minimum inventory position. The inventory position repeats
with a cycle time of . .
|
Formulas for Instance Results |
| |


Click buttons to see the notation
|
Here
we derive the formulas for the results for an instance.
In addition to the inventory parameters, two variables
are necessary to describe the pattern in the figure. As
before, one of the variables is the lot size, q.
We choose as the second variable the fill rate, v.
The fill rate is the proportion of the demand that is satisfied
immediately from inventory. The proportion that is not
satisfied from inventory, but is backordered is 1-v.
Other quantities could have been selected for the second
variable such as maximum or minimum inventory position,
but fill rate characterizes most of the situations involving
shortages on these pages. The model requires one new parameter,
the cost of a backordered order per unit time ( ).
Click the Parameters button on the left to see
the definitions of the parameters and variables used for
the analysis. We will derive formulas for the quantities
defined on the page reached by the Results button.
These formulas are implemented in the Inventory add-in. ).
Click the Parameters button on the left to see
the definitions of the parameters and variables used for
the analysis. We will derive formulas for the quantities
defined on the page reached by the Results button.
These formulas are implemented in the Inventory add-in. |
|
|
To construct a mathematical model
describing the economic costs or profits associated with the
inventory system, we show the cash flows below. This figure
is a mixed representation of discrete as well as continuous
cash flows. The arrows represent amounts paid or received at
points in time. The areas represent continuous cash flows given
by rates. Positive amounts are revenues, while negative amounts
are expenditures or costs. The blue area indicates revenues
from sales from the inventory. The revenue arrives continuously
during the early part of the cycle until the level reaches 0.
The remainder of the revenue is received at the end of the cycle
when the replenishment arrives. The red area represents holding
cost and the purple area represents backorder cost. The fixed
setup cost A and the product cost Cq are incurred
at the beginning of each cycle.
A single inventory cycle is shown below.
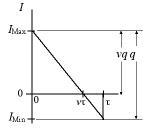
The table below shows the various revenue and cost components
and their respective cost rates. We compute the holding and
backorder costs during a cycle with expressions for the associated
triangular areas. The rates are the cycle costs or revenues
divided by the cycle time.
| Item |
Amount during a cycle |
Cost or revenue rate |
| |
A |
|
| Product Cost |
Cq |
|
| Holding Cost |
|
|
Backorder Cost |
|
|
Revenue from product Sales |
Rq |
RD |
For this model there are two decision variables q
and v.
Additional quantities associated with the inventory policy
are derived below.
When we compute the mean residence time for items held in inventory,
we use Little's Law but only use the flow rate for items that
are actually held in on-hand inventory. Similarly, when we compute
the mean backorder time, we use as the flow rate only those
items backordered. We feel that these measures are more interesting
than the corresponding quantities computed with the entire flow
rate through the system.
The measures are computed below for the example using a lot
size of 400 units and a fill rate of 90%. The figure shows a
single cycle of the inventory pattern.
|
Optimum Policy |
| |
For determination
of the optimum lot size q* and fill rate v*,
the unit revenue and unit purchase cost can be neglected and
we write the expression for the cost rate for operating the
inventory. We find the optimum values by setting the first partial
derivatives to zero and solving. The solution is a global optimum
since the functions in the inventory cost expression are all
convex.
We first take the partial derivative with
respect to the fill rate.
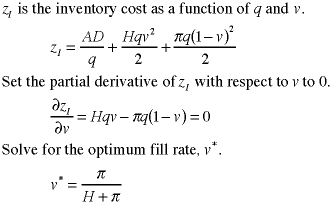
The optimal fill rate is a ratio involving
the unit holding cost and backorder cost. It does not
depend on the lot size.
We next take the partial derivative with
respect to the lot size.
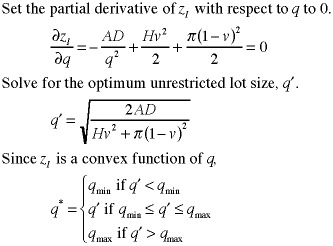
Given the fill rate, the optimum lot size
for that fill rate can be determined from the formula
above. Using the optimum fill rate, the optimum lot
size is determined. The results below assume the lot
size is unrestricted.
Note that the lot size is larger than
the lot size when no shortages are allowed by the ratio
 . .
The optimum inventory cost is reduced
by the inverse of the ratio.
|
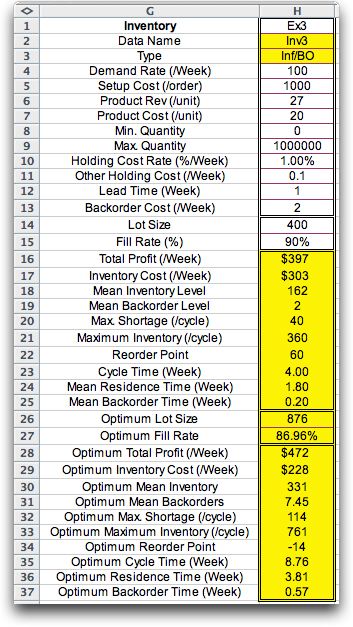
The table below shows the parameters and instance results as
well as the results for the optimum lot size and fill rate (q*=
876, v*= 86.96%).
|
Fixed Charge in the Event of Shortage |
| |
The two remaining cases considered on page involve backordered
shortages with different cost models. Here we consider a situation
where the only charge associated with a shortage is a fixed
charge  that is incurred in any cycle that a shortage occurs. The charge
is independent of the number of customers that are affected.
We will see that the results of this case lead to an unrealistic
solution.
There are two expressions for the inventory
cost depending on whether a shortage is allowed or not.
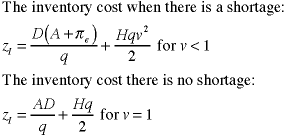
If we specify a specific value of q
and require that v < 1, the minimum
inventory cost occurs when v = 0, and all demand
is satisfied through backorders. The figure below shows
the inventory position when demand is entirely satisfied
from backorders.
The optimum policy for a given q
is found by comparing the cost for the two cases: v
= 1 and v = 0.
When q is allowed to vary, it
is clear that the optimum lot size is unbounded. It
is best to increase the lot size as much as possible
with v = 0.

The model is unrealistic in this case,
because demand is satisfied only after an infinite wait.
The revenue as well as product cost is not received
until after a very long time, but the model does not
penalize this because it does not consider the time
value of money.The analysis assumes that lot sizes are
unrestricted. When the lot size is restricted by  ,
the inventory cost for the two cases v = 1
and v = 0.must be compared to find the optimum. ,
the inventory cost for the two cases v = 1
and v = 0.must be compared to find the optimum.
|
|
Fixed Charge for Each Unit of Shortage |
| |
Here we consider a situation where
there is a fixed charge  that is incurred for each unit of shortage. The charge is independent
of the wait for the backordered item.
The inventory cost rate has three terms:
setup cost, holding cost and shortage cost. We set the
partial of the cost function with respect to v
to zero.
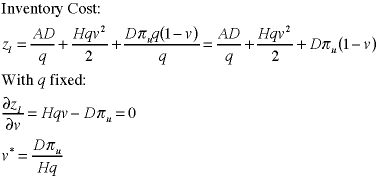
The value of the fill rate can be no more
than one so we find two cases for the optimum.
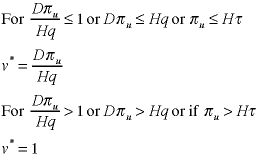
When the unit shortage cost, ( ),
is less than the cost to hold an item for the full cycle
( ),
is less than the cost to hold an item for the full cycle
( ),
it is optimal to allow a shortage, otherwise no shortage
should be allowed. ),
it is optimal to allow a shortage, otherwise no shortage
should be allowed.
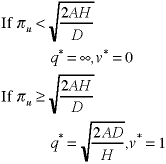
To find the optimum lot size we must compare
the inventory cost with and without shortages. When
a shortage is allowed it is optimum to have a fill rate
of 0 and an unbounded lot size. When a shortage is not
allowed, the optimum lot size is given by the EOQ formula.
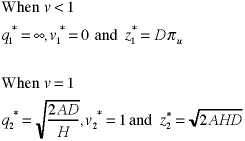
The optimum solution is the policy with
the smallest cost. Note that the first case suggests
an infinite lot size with all items backordered and
the second case suggests no shortages.
The analysis assumes that lot sizes are
unrestricted. If the upper or lower bound on the lot
size is violated by a solution, the inventory cost must
be evaluated it the limit values to determine the optimum
values.
|
|
| |
|
|
