|
|
 |
Investment
Economics |
 |
-IRR/RIC
|
 |
The IRR of a project is its Internal
Rate of Return. The IRR is the interest rate that makes the
Net Present Worth (NPW) of the project equal to 0. It is a measure
of merit of the project, and we say that a project is acceptable
if its IRR is greater than the minimum acceptable rate of return
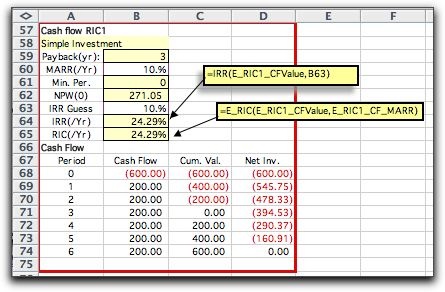
(MARR). Excel has a built-in IRR function illustrated for example
1 in the figure below. The function has two arguments. The first
argument is a range of cells on the worksheet. For the example,
the range consists of the cells B26 through B31. This range has
the name E_Proj1_CFValue. The function assumes that the numbers
in the range are the cash flows for a consecutive series of times
which, for the example, are the times 0 through 6. The second
argument is a guess that is used to initiate a numerical search
for the IRR. For the example this argument points to B20 which
holds the value 10%. When the IRR is unique, this guess is not
important. When a project has more than one positive IRR, the
guess determines which solution is displayed. |
| |
Example 1
|
| |
The add-in provides a second function
called the E_RIC function. RIC stands for Return on Invested
Capital.
This is a user-defined function and we
identify it with the prefix E_ so that it appears along with
the other user-defined functions of the Economics add-in. Again
this function has two arguments. As for the IRR function, the
first function is a range holding a series of cash flows. The
second argument is the rate the organization earns for investments
outside of, or external, to the project being considered.
For the example we use the MARR is in cell B17, named E_Proj1_CF_MARR
for this external rate.
The RIC is related to the IRR, and it is defined as the interest
rate that makes the net invested capital equal to
zero at the end of the project life. For Example 1, the RIC
and the IRR are the same. This is always true for simple investments.
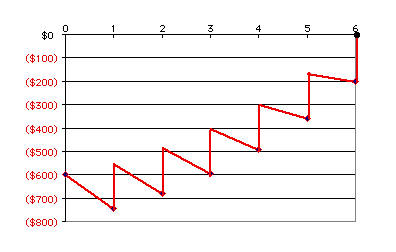
We illustrate the RIC computation in the figure below. |
| |
The Net-Invested
Capital for Example 1
|
| |
We call the figure shown above
the net-invested capital (or net investment). For
each discrete time interval we compute the net-invested capital
as:
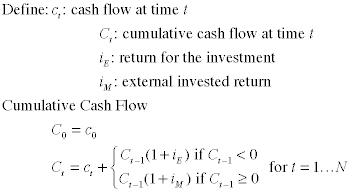
According to the formula, the cash flow grows at the return
associated with the investment being evaluated for negative
cash flows and with the external return for positive cash flows.
The RIC is the interest rate that makes the cumulative
cash flow at time N (the project life) equal to 0. The
figure above shows the net investment for the rate 24.29%.
For this rate the value at time N is zero, so the RIC
is 24.29%. For this example, as for every simple investment,
the cumulative cash flow is always negative and the IRR and
RIC are the same because there are no positive cumulative cash
flows.
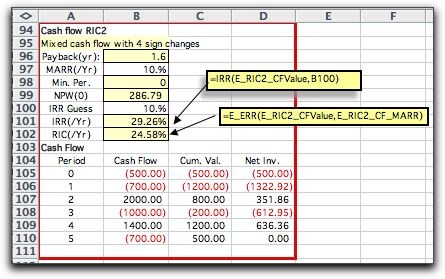
To illustrate a case where they are different, consider the
cash flow for example 2. |
| |
Example 2
|
| |
This is a mixed cash
flow, because we see that the cash flow column has three four
changes. An initial period of investment at times 0 and 1 are
followed by a large return at time 2. Then another investment
at time 3 is followed by a return at time 4, and finally another
investment at time 5.
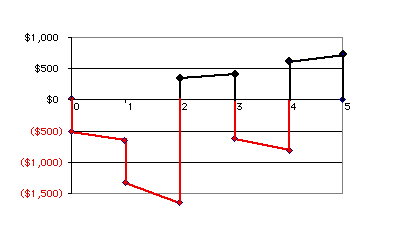
Plotting the net investment for this case for
the interest rate 24.58%, we see that the future value is not
always negative. At times 0 and 1, the net investment is negative
and we apply the 24.58% rate. At time 2, the value becomes
positive and for the interval from 2 to 3, and we let the cash
flow grow at the MARR rate (10%). The net investment changes
sign from positive to negative at time 3 and negative to positive
at time 4. For this case the IRR is about 29% and the RIC is
about 25%. |
| |
The Net-Invested
Capital for Example 2
|
| |
Although both the
IRR and RIC are measures of merit, the RIC seems more rational
for mixed investments. As in example 2, the project is an investment
for the first two periods and in period 4, but during periods
3 and 5, the project is a lender. The project itself is not
making money by its own actions in periods 3 and 5, but rather
it is loaning money to the investor. During this period the
project funds are earning the external rate of 10%. The return
during these periods is better reflected by the MARR.
In addition to being a more reasonable measure,
the RIC has the advantage that it has at most one solution
for a given project, while the IRR may have more than one solution
for non-simple investments. The RIC computation will fail if
there is no interest rate for which the cumulative RIC cash
flow is zero at the end of the project. Even when the IRR
has only one solution for a cash flow with positive
net investment the RIC will be different.
We should point out that a number of ways have
been suggested to address the multiple root case associated
with the IRR. The most popular seems to be the modified
internal rate of return (MIRR). This method uses two external
rates one for positive net investment, as used here) and one
for negative net investment. Excel provides the MIRR function
that computes this measure. The MIRR function is extensively
discussed at several Web sites and in popular text books on
Engineering Economics. The MIRR function can easily be applied
to the cash flows provided by this add-in. We have programmed
the RIC function because it seems more rational to this author.
It is also described on the Web. |
| |
|
|


