|
|
 |
Investment
Economics |
 |
-Taxes |
 |
The add-in can also be used to analyze economic alternatives
when taxes are considered. We repeat the example used earlier,
but add tax considerations.
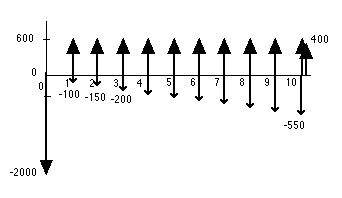
A businessman is considering the purchase of an asset that
has an initial cost of $2000. The asset promises an annual return
of $600. It's operating cost is $100 the first year, $150 the
second, and increases by $50 in each subsequent year. The salvage
value for the asset in 10 years is $400. The cash flow for this
situation without consideration of taxes is shown in the figure
below.

To include taxes, we observe that the tax rate
for ordinary income is 25%, and the tax rate for capital gains
is 15%. The initial cost of the asset is to be depreciated over
a 5 year tax life using the MACRS method. The tax salvage is
zero. If the businessman's after-tax minimal acceptable rate
of return is 10%, should he invest in this project?
The project is defined by choosing the Add_Project
item from the Economics menu. Clicking the tax box on the
dialog, enables the depreciation buttons at the lower left.
We have
chosen MACRS from the five depreciation types available. |
| |
|
| Project Definition |
| |
On clicking OK, the project definition
appears on the worksheet. Several new columns are necessary with
taxes in the analysis. Most of these are in the investment data
part of the worksheet. |
| |

Click the image to expand
|
| |
Investment
Data
The columns associated with the investment
data are each described below.
Column |
Description |
Index |
The index identifies the investment. There
may be several investments that comprise a project and
each has a row in the display. |
Description |
A short description of the cash flow
component. |
Depr. Type |
Assets are depreciated with one of the common methods.
Several are provided. Refer to standard texts for a complete
description.
- None: The asset is not depreciated.
- MACRS: The Modified Asset Cost Recovery System
is a US government approved depreciation method.
It provides depreciation percentages for each year
of the tax life. The tax life must be 3, 5, 7, 10,
15, 20 27 or 39. Any other values will produce a
calculation error.
- Straight Line: The depreciation is the same in
every year of the tax life.
- SYD: The sum-of-years digits-method is provides
accelerated depreciation.
- DRDB: The Double Rate Declining Balance method
depreciates the remaining book value at twice the
straight line rate.
- 1.5DB: Although this type is not listed on the
dialog, it is allowed by the functions that computed
depreciation values.
- DRDB with a switch point. This is entered by placing
DRDBsw in the type cell. The depreciation is determined
with a switch point at the optimum time.
- 1.5DB with a switch point. This is entered by placing
1.5DBsw in the type cell. The depreciation is determined
with a switch point at the optimum time.
|
Amount |
This is the expenditure for the investment.
It should be a negative number. The value is the basis
for the depreciation and the cash flow at the start time. |
Tax Life |
This is the life used for computing depreciation.
It may be different than the actual life of the asset. |
Start |
This is the time at which the asset investment
is expended and the beginning of the depreciation period.
The first depreciation amount occurs one year after the
start time. |
End |
This is the time when the asset is retired.
At this time the salvage value is received and any tax
effects for disposal are received or expended. |
Salvage |
This the amount received by selling the
asset at the end of its life. It is usually a positive
number, but it could be negative if there is a cost of
disposal. The salvage value is entered as a percentage
of the first cost. If it is entered as a positive percentage,
the salvage will be an income. If it is a negative percentage
the salvage value is an expenditure. |
Tax Salvage |
This is the salvage value used to compute
depreciation. It is entered as a percentage. The depreciation
of all types is computed using the
Initial Cost - Tax Salvage
This is true even for the depreciation
methods that usually assume 0 tax salvage. Thus a depreciable
asset that includes some non-depreciable proportion can
be easily entered. Use 0 tax salvage if the depreciation
method normally assumes this value. |
Fin. NPW |
This is the Final net present worth associated
with the asset over its life, considering depreciation
effects, disposal at sale and taxes. |
|
| |
Cash
Flow Data
This data is similar to the data for projects not considering
taxes. The only change is an additional column holding the
tax rate. For most cash flows this column will hold the ordinary
tax rate, however, the rates may be changed for individual
cash flows. |
Cash Flows |
| |
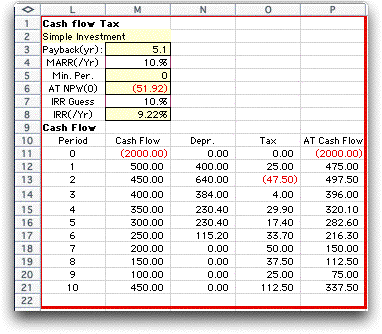
Selecting Show Cash Flows from
the Economics menu builds the cash flow described by the project.
When the project has tax parameters defined, the cash flow
has two new columns, one for the depreciation in each year
and one for the taxes. The results for all investments and
cash flows are combined in these columns. For the example,
we see the depreciation amounts prescribed by the MACRS method.
The column at the far right is the after-tax cash flow. It
is used to compute the NPW and IRR values at the top of the
display.
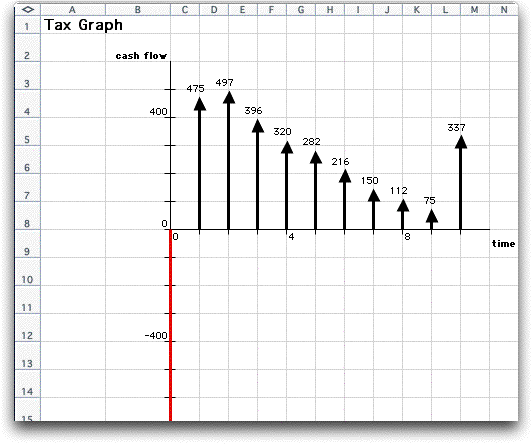
The graphical display shows the after-tax cash flow. |
| |


|
| Comparing Projects |
| |
When two or more projects have been
defined, they can be compared in the same manner as projects
without taxes. All projects involved in a comparison must have
the same tax treatment. To illustrate a comparison, we introduce
project Tax2 below with more investment than Tax and greater
annual return. Tax2 uses straight line depreciation. |
| |

Click the image to expand |
| |
The cash flow for Tax2 illustrates
the effect of the straight-line depreciation over the five year
tax life.Since the useful life is ten years, there is no depreciation
after year 5. |
| |
|
| |
The comparison of Tax with Tax2
is shown below. We have chosen Tax2 as the challenger because
it has the greatest initial investment. The extra investment
of Tax2 over Tax is justified because it has a 13.39% rate of
return, greater than the minimum acceptable rate of return. From
the two investments we would choose Tax2. |
| |
|
| |
|
|


