Computation Section
Subunit Vehicle Routing
 - Distance

Vehicle routing involves travel distances and the corresponding travel times. The add-in stores the locations of selected points within a region on the Distance worksheet. These are the map locations. Points may be specified with either Cartesian or Geographic coordinate systems. Distances between map locations are specified in miles or kilometers. Distances are computed with either the straight-line measure (Euclidian) or by the length of the line that follows the curvature of the earth (the Great Circle Distance). 
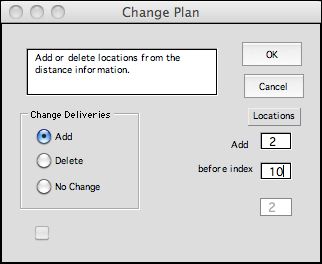
Options regarding locations on the map are determined by filling the dialog below. A button on the Start worksheet 
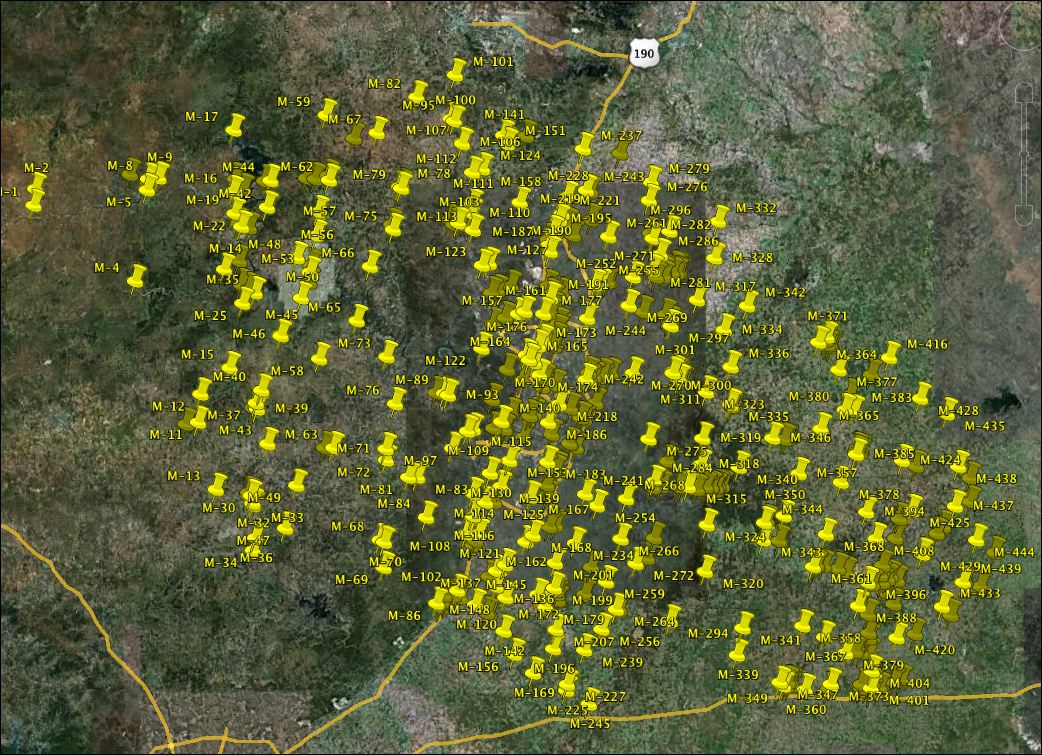
calls this dialog. The example is the 446 point representation of the Austin area as pictured on the summary page.

map dialog

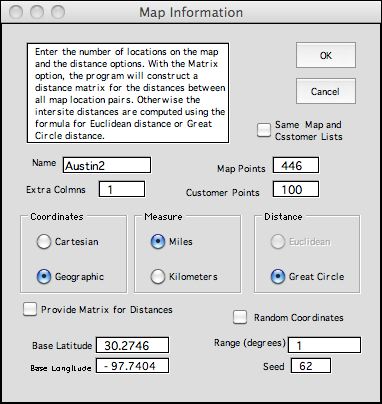
The Name and Map Points fields are filled with the name of the distance worksheet and the 
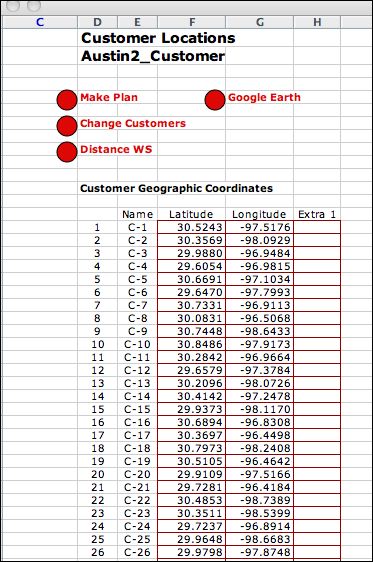
number of map locations. The add-in creates a second worksheet, the Customer worksheet, to store customer locations. The number of locations is entered in the Customer Points field. Both distance and customer worksheets use four columns to represent the index, name and the two coordinates for each point. The Extra Columns field adds blank columns to hold additional data such as address or phone number. The Same Map and Customer button makes the number of customer points equal to the number of map points and links the customer data to the map data with formulas. This is illustrated on the summary page.

The three decision pairs in the center of the dialog set the type of coordinates, distance measure and distance calculation. With Cartesian Coordinates the Euclidean measure is always used. It is the straight line distance between two points. The Great Circle measure computes the distance between two points considering the curvature of the earth. The equations assume the earth is spherical. This measure is always used when Geometric Coordinates specify the locations.

When the Provide Matrix for Distances button is checked, the point-to-point distances between all pairs of map locations are calculated and stored in a square matrix on the distance worksheet. Otherwise only the coordinates are stored and the distances are computed as needed. Of course, when a large number of map locations is specified, the matrix defining the distances is correspondingly large. Although the matrix is initially filled with distances computed with one the measures, the purpose of the matrix is to hold more accurate distance values.

The concept used for this analysis tool is that most travel is between major travel destinations in a local region. Map locations identify major intersections, 
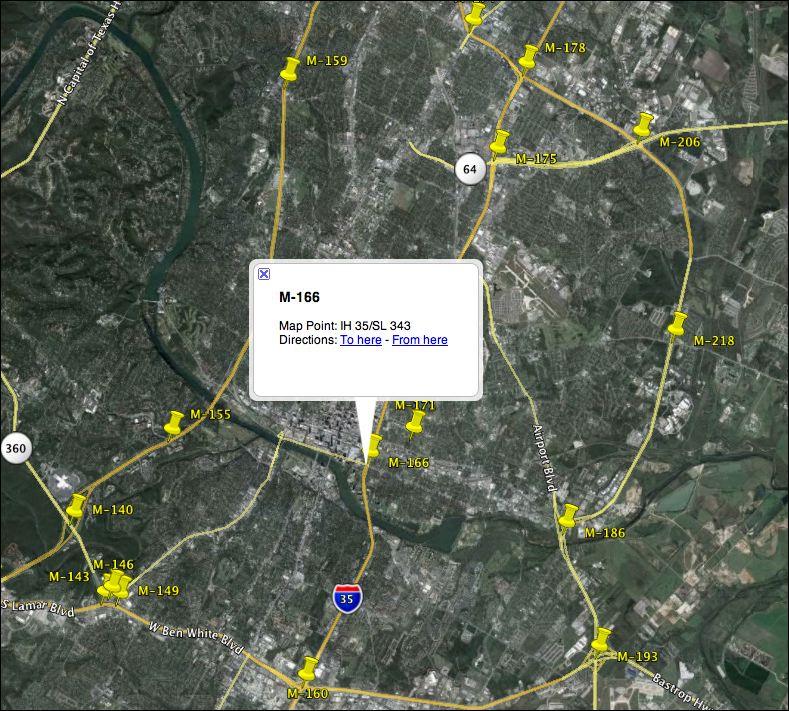
apartment complexes, shopping malls and business parks. Over time the distances or travel times between these fixed locations can be measured carefully or obtained from some database of travel times such as Google Maps or GPS systems. Individual customer locations can be located relative to these fixed locations and the extra travel time estimated using the Euclidean measure and average travel speeds.

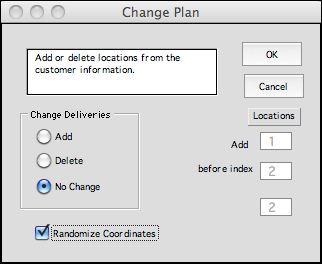
The Random Coordinates checkbox causes the add-in to generate random coordinates for the locations. This is handy when learning about the add-in and building large models without much data. The random number seed controls the sequence of random numbers. Change the seed to obtain a different set of map points. The base values determine the origin of the distance map and the range determines the upper and lower bounds of randomly generated map points.

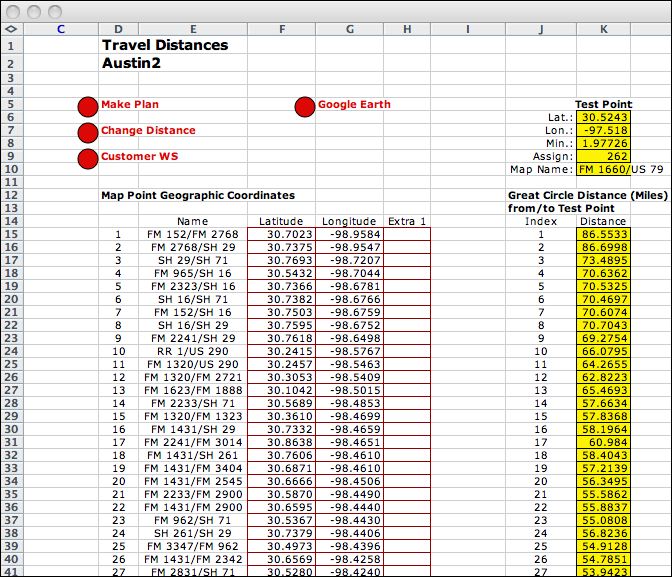
On clicking the OK button on the dialog, the distance worksheet created by the add-in is illustrated below. The names are in column E and geographic location coordinates are in columns F and G. Column H is an extra column intended for some additional data item regarding map points. Although it is customary to specify geographic coordinates in degrees, minutes and seconds together with N, S, E, and W, designations, we use the more concise decimal coordinates (latitude, longitude). The origin for latitude is the earth's equator and measures distances north and south of the equator. Latitude varies from -90, the latitude of the south pole to +90, the latitude of the north pole. Points south of the equator have negative latitude and points north of the equator. have positive latitude. The origin of longitude is the Royal Observatory, Greenwich England, with points east of Greenwich having negative values and points east having positive longitude. Longitude varies from -180 to +180. The international date line is at both maximum and minimum longitude.

The numbers in column K are used to measure the distance of each map location from a fixed location on the map. To illustrate, K6 and K7 hold the coordinates of the first customer location. Numbers starting in row 15 and continuing compute the distance to all 446 map points. K8 computes the minimum value in this list and K9 is the map location closest to the first customer. K10 holds the map location name. This list is used to assign customers to their closest map points.

 
distance worksheet 2


Customer Worksheet

  The customer worksheet is built immediately after the distance worksheet. The example uses 100 costumers with locations defined randomly. For real problems, the customer locations will be computed as orders arrive using a map application or GPS. In general, not all customers will be visited on a given day. Rather a selection of the customers will comprise a plan. In general, customers may or may not be located at a point described by the distance worksheet.
 
customer worksheet
  For this version of the add-in, each distance worksheet has a unique customer worksheet.


Google Earth

  Map locations can be displayed on Google Earth by clicking the Google button. The figure below shows the points for the Austin example.
austin map
  The figure below shows a smaller selection of map points. Those familiar with Austin can see Town Lake passing downtown. Clicking the stick pin brings up information on the point.
 
austin map small


Changes


Once constructed, locations for either the distance or customer worksheets can be added or deleted using the Change button. The two change dialogs are presented below. For the worksheet dialog, on the left, we are adding two new map points on the distance worksheet. They are inserted before point 10.

The dialog at the right is for the customer worksheet. You can add or delete customer points, but this dialog also has an option to Randomize Coordinates. When checked, each coordinate pair are generated randomly with the distance worksheet mean value and range used to simulate points on the customer worksheet. This is useful when demonstrating the add-in with measured map points and random customer locations within the range of the map points.

change distance
change customer


Distance Matrix


Distance information for problems with a small number of map points can be stored in a matrix. This is necessary when neither Euclidean or Great Circle distances are appropriate. For instance, airline fares between pairs of cities are generally not proportional to the distance traveled. The distance dialog offers a check box to indicate the matrix format. The figure below shows part of the distance matrix for a 30 location problem. Of course the matrix has as many columns as rows, so the number of map points is limited by the columns allowed in Excel. The Austin distance matrix with 446 points is too big for Excel 2003 worksheet used by the author.

Another problem with the matrix format is the large number of individual distances that must be computed and stored, the square of the number of map points.

On initial construction of the matrix the cells are filled with either formulas that compute Euclidean or Great Circle distances. After construction is complete the matrix equations are replaced with the values in the matrix, reducing the number of equations that must be stored with the worksheet. Whenever the coordinates are changed, the map distances must be recalculated with Compute Matrix button at the top of the worksheet.


The figure shows several additional cells in columns N and O. The base coordinates in N2 and O2 define roughly the center of the region encompassed by the map points. When map points are simulated with random numbers, the base coordinates determine the mean values of latitude and longitude. For Cartesian coordinates the base values determine the origin of the maps constructed by the add-in.

The distance range in N3 defines the lower and upper bound of simulated coordinates. The simulation assumes a uniform distribution of values within the range. The range measured in degrees is usually very small, because one degree difference between two latitudes is equal to over 69 miles (computed in N4). This number is valid anywhere on the earth, assuming a spherical shape for the earth. The length of a degree of longitude varies depending on the value of latitude. At 0 degrees latitude the distance between two points separated by 1 degree of longitude is about 69 miles, the same as 1 degree of latitude. As the points move north or south toward the poles, the distance for 1 degree of longitude decreases. At 30.27 degrees latitude the distance for 1 degree of longitude is the value computed in N4, about 69.67 miles.


Cartesian Coordinates


This examples on this a page use geographic coordinates, latitude and longitude, to describe location. Alternatively, distances can be specified by Cartesian coordinates, x and y. This assumes that the earth is flat, which of course is an approximation. This is reasonable if the study area is small, such as a small city. Since local maps are printed on flat paper, Cartesian coordinates can be estimated by measuring the map with a ruler. The internal Map option uses Cartesian coordinates. Geometric coordinates are converted to Cartesian coordinates using the miles per degree values computed on the distance page.


Return to Top

tree roots

Operations Management / Industrial Engineering
Internet
by Paul A. Jensen
Copyright 2004 - All rights reserved