Computation Section
Subunit Vehicle Routing
 - Geographic Coordinates
The add-in allows map points to be located by their geographic coordinates, latitude and longitude. We illustrate this feature with an example using 50 locations representing the 48 states in the continental United States and Washington DC. Washington DC is included twice in the example because the truck depot is located there. The goal is to find the traveling salesman solution for visiting each state and Washington DC. The workbook for the example is Route States.

Geographic coordinates are easy to obtain through computerized mapping systems, such as Google Maps, or Geographic Information Systems. To use geographic coordinates click the Geographic button on the map information dialog. We also choose to measure the distance between two points using the Great Circle distance. An add-in for computing the Great Circle Distance is implemented as a User-Defined Function in the Routing add-in VBA code. The code was downloaded from a web page by Pearson Software Consulting.


The worksheet created by the add-in 
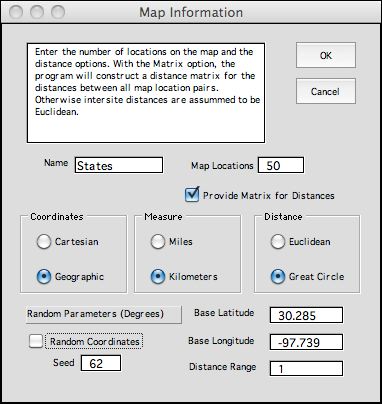
is illustrated below. Geographic coordinates are latitude and longitude. The location coordinates in columns F and G are the average values for the U.S. states. The values are from the web site by Max Mind.

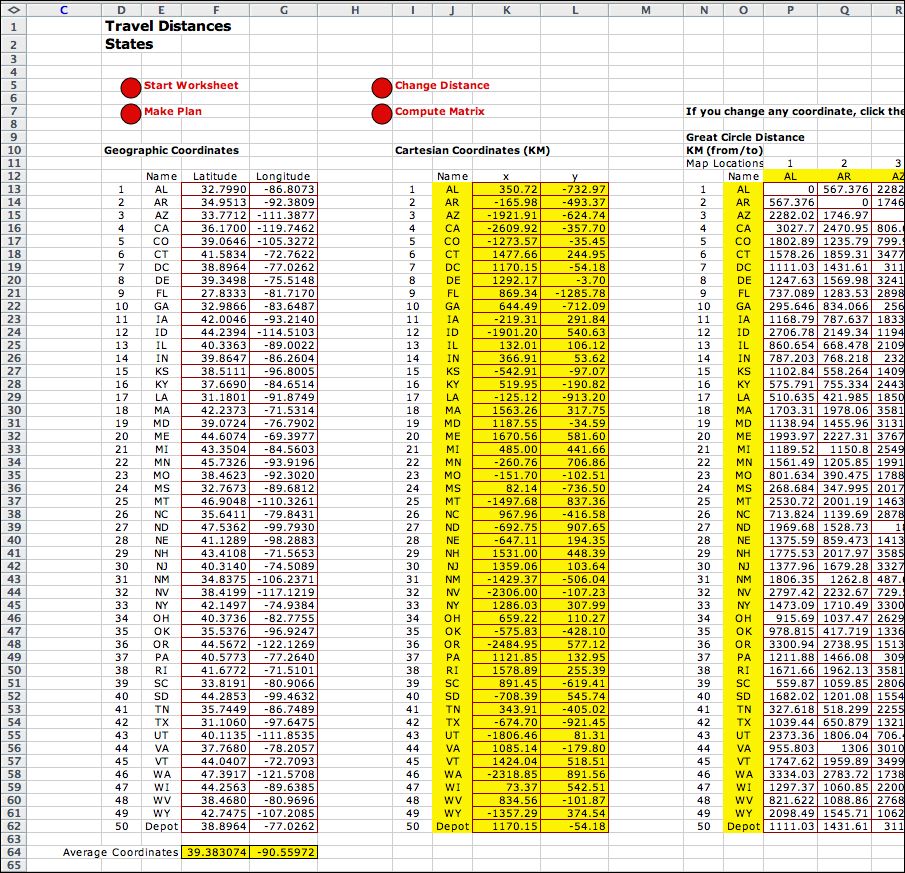
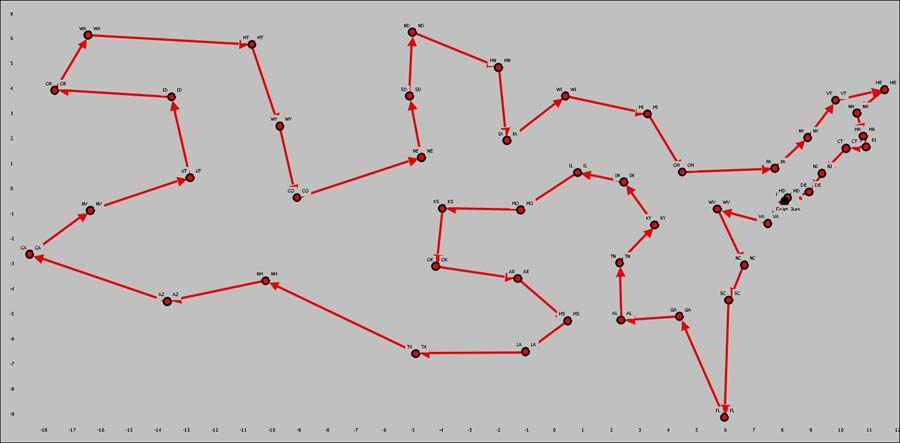
The add-in uses Cartesian coordinates to plot maps of the solution. The values x and y in columns K and L hold the Cartesian coordinates equivalent to the Geographic coordinates in columns F and G. The origin point for coordinates is obtained by averaging the latitudes and longitudes in cells F64 and G64. Column y is computed with a linear function of the latitude values. Assuming that the earth is a perfect sphere, two points with the same longitude but with latitudes that differ by one degree are 111.325 kilometers or 69.172 miles apart. The value of y for Alabama is in cell L13.

L13=111.325*(States_D_Lat-States_D_Avg_Lat)

The difference between two points that have the same latitude is not a linear function of the longitude. The difference expressed in KM is greatest at the equator which has 0 latitude. As the latitude increases in value, the points move into the northern hemisphere where the difference per unit of longitude decreases. Similarly, moving from the equator into the southern hemisphere decreases the distance between two points at the same latitude. We determine the x column using the great circle difference computed by the User-defined function "GreatCircleDistance" adapted from a web page by Pearson Software Consulting. The value of x for Alabama is in cell K13.

K13=GreatCircleDistance( F13,States_D_Avg_Lon,F13,G13,2)

The entries for the Great Circle Distance matrix are also computed with the GreatCircleDistance function. The matrix is originally computed by filling in all the entries with the function. Then the entire matrix is selected. The entries are copied and their values are pasted (with the Paste Special Values command). The values in the cells then are constants and not functions. This reduces the burden of storing a large number of function calls in the matrix. Whenever the geographic coordinates are changed, click on the Compute Matrix command to regenerate the matrix values.


Plan


Clicking the Make Plan button creates the Planning Data worksheet. The truck data and part of the delivery data is shown below. To solve the TSP problem we use the default (non-binding) parameters for the plan. We assign the depot a capacity of 49, and loads of 1 for the states (including also Washington DC). Clicking the Make Model button creates the Results and Models worksheets. Since the travel cost per unit distance is positive, solving this problem will minimize the total distance traveled.

states plan


Results

  The Results worksheet shows the sequence found by clicking the Improve Current Solution button. The solution process started with the states ordered in alphabetical order. The final solution was obtained in about six minutes.


Map

  The map shows the solution obtained. The nodes at the right of the figure are states along the eastern seacoast and the nodes at the left are the widely spaced states in the west. The locations are plotted with the Cartesian coordinates computed on the Distance Worksheet. This may not be the optimum. Alternative solutions can be obtained with random starts or using the randomized greedy heuristic.
states map
  Since Great Circle distances are computed with a user defined function, worksheets that use the function will not work if the file is opened on computer that is different than the one that created the function. The Start command relinks the function to the add-in on the new computer.
 
  
Return to Top

tree roots

Operations Management / Industrial Engineering
Internet
by Paul A. Jensen
Copyright 2004 - All rights reserved