|
|
 |
Project
Management |
 |
-
Project Network |
 |
The Project Network describes the project in an ordered
way necessary for critical path analysis. There are two ways to
construct a network for the analysis, activity on arc
and activity on node. The activity on arc representation
is the preferred method for most introductory textbooks because
it often results in smaller networks and is simpler for hand calculations.
The activity on node representation is more convenient for computer
implementations, however, and we use it for the Project Management
add-in.
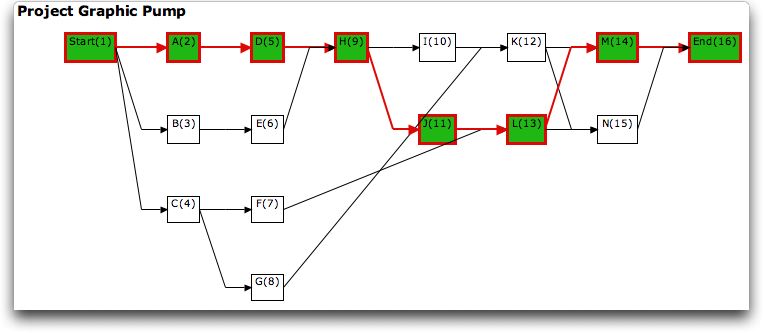
The project network is shown below for the example. The rectangular
boxes are the nodes that represent the activities. Activity
names are shown in the boxes. The number with a name is the
index of the node in the project network. The arcs connecting
the nodes describe the precedence relations. The graph, which
is constructed by the add-in, also shows the nodes and arcs
on the critical path. |
Nodes
|
| |
When the Solve button is clicked, the add-in
creates a new worksheet with the network construction.
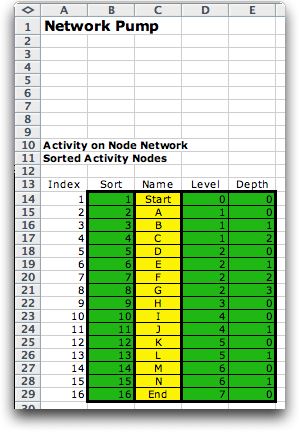
The node information is placed on the left side of the
worksheet beginning in column A. There is a node for each
activity. It is important that the nodes be indexed so
that if node i precedes j in the project,
then i < j. If the indices of the
activities do not have this order, the activities are sorted
before they are assigned to nodes. The sorted order of
the activities is shown in column B. This column is colored
green because it is computed by an algorithm rather than
a formula. The network is not dynamic, and every time the
structure of the project changes a new network must be
constructed by clicking the Solve button. Since
the original definition of the activities were ordered
correctly in the example, column B has an increasing sequence
of integers. Column C holds the names of the activities,
transferred by formula from the Project worksheet.
Columns D and E are used for the graphical display. The Level for
some node i is the number of arcs traversed on
the longest path (in number of arcs) from the start node
to node i. We see for the example that there are
7 arcs on the longest path from node 1 to node 16. These
numbers determine the horizontal placement of the nodes
on the graph with the smallest numbers nearer the left
margin of the worksheet. The Depth determines
the vertical placement on the nodes on the graph with the
smallest numbers near the top of the worksheet. The add-in
uses a fairly arbitrary method for setting the depth that
assures that no two nodes have the same position on the
graph. The project network display at the top of the page
was constructed with the levels and depths of columns D
and E. |
 |
|
| |
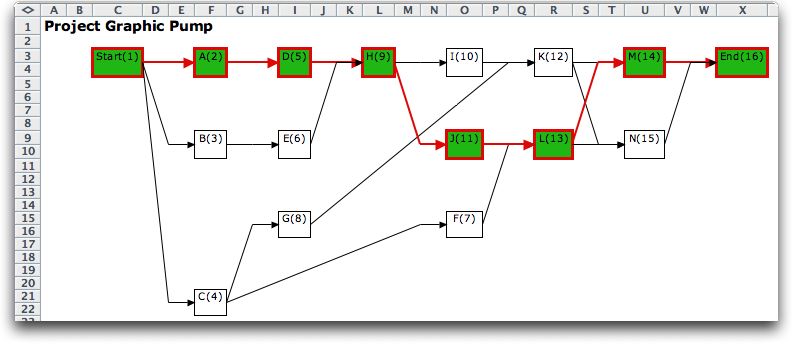
Sometimes the arcs describing two precedence
relations overlap with the default locations and the user
may wish to change the level and/or depth numbers in columns
D or E to get a more pleasing graph. We decide to change
the locations of activities C, F and G to clarify the arc
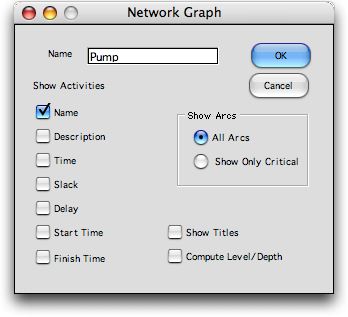
display. The changed node display is below. To create the
new project network choose the Graph button on
the project page. In the Network Graph dialog,
leave the Compute Level/Depth box unchecked. This
constructs the graph directly from the data entered in
columns D and E. Checking the box, recomputes the default
level and depth values.
|
 |
|
| |
The modified network
is below. |
 |
Arcs |
| |
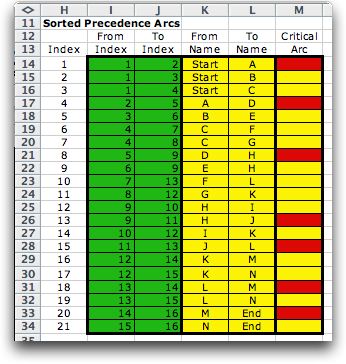
| The arcs on the project network
describe the precedence relations. For each arc, the To
Index,
in column I, is the index of a node and the From Node,
in column J, is the index of a predecessor of the node. Activities
with no predecessors in the data are given arcs coming from
the start node. Activities with no successors are given arcs
going to the end node. When the arcs are sorted first by
the From Index and second by the To Index,
the arcs appear as at the right. The From indices
are increasing from top to bottom. For a given From node,
the To indices are increasing from top to bottom.
This is accomplished automatically by the computer. The From and To names,
in columns K and L, are provided to relate the arcs to the
activities. The cells colored red in column M indicate arcs
on the critical path. The critical arcs are colored by an
algorithm initiated through the Show Critical button
on the project worksheet. |
 |
|
| |
|
|


