|
|
 |
Project
Management |
 |
-
Update |
 |
Critical path analysis is a planning technique for scheduling
future activities. After the project actually begins, activities
start and become "in progress". Eventually activities
finish. At any given time, some activities are finished, others
are in progress and others have yet to begin. Finished activities
may require different times than originally estimated, and estimates
for in-progress activities may also require adjustment. Once
these are reflected on the data, planning for future activities
can and should be changed. The add-in offers several options
through the Update button at the top of the worksheet.
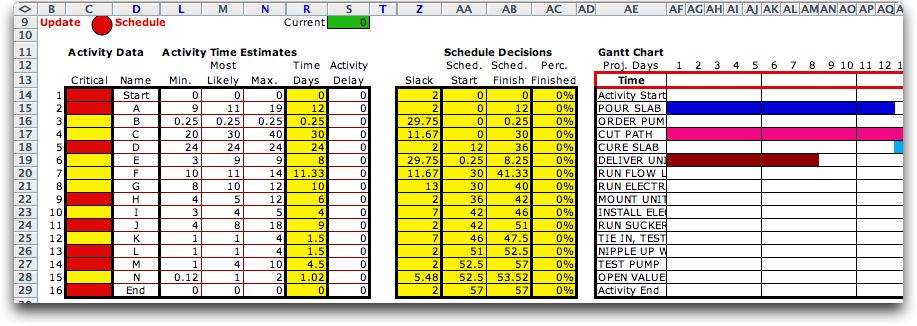
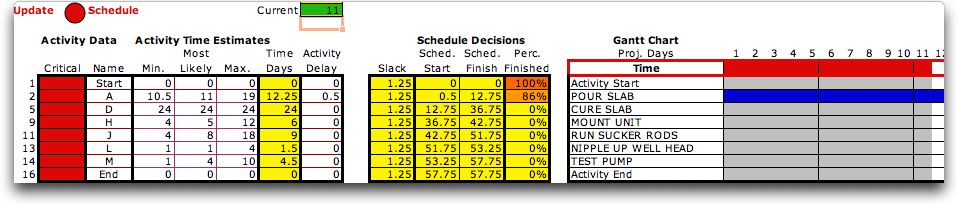
We start with time 0 of the pump example. The scheduled start
and finish times are the early start schedule. The
current time is shown in the green cell above the delay column,
S9. Here it is 0. |
|
| |
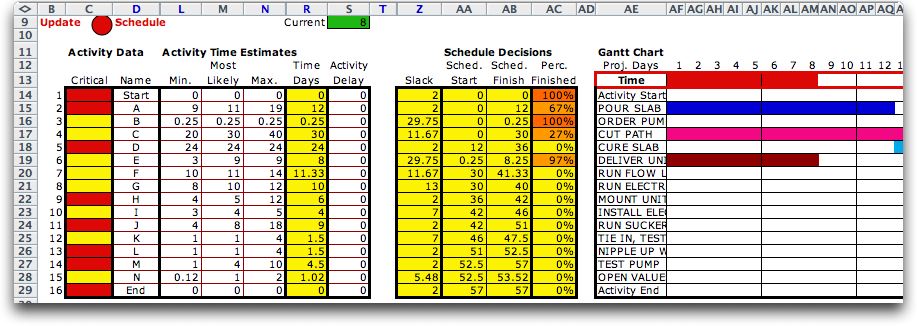
We can track the progress of the project
in real time by simply changing the current time in cell S9. The Percent
Finished column adjusts to indicate the proportion of the
activities that a complete at time 8, and a red bar advances in
the Time row of the Gantt chart. The scheduled start and
finish used for the Gantt chart and the percentage finished assume
that the activities start at the ealiest start time and require
the mean time to complete. |
|
| |
Of course if one were tracking an
actual project, the estimates of minimum, most likely and maximum
times as well as the activity delays may change. These can be
described by changing the associated cells on the spreadsheet.
This will affect activity durations, slacks, and scheduled start
times. |
Update Button |
| |
The program provides and automated
update procedure implemented through the update button. The
button is used at the end of each time interval, assumed to
be days for the example, and provides a series of dialogs that
describe the events that may have happened during the day.
We start with the current time as 0 as given in the top figure
of this page.
To
update the project to account for advancing time, click the Update button.
The Update
dialog appears as below. The current time is
given and a field for a new time is provided. The
default value for the new time is 1 greater than the current
time, but any positive number may be used depending on how
often the project is reviewed. The Do not change time checkbox
is provided so that the display may be changed while keeping
the same time.
Buttons at the bottom left determine which activities
are to be displayed. These are illustrated later on this page.
The buttons at the bottom right determine which
activities are to be reviewed during the update process. When
the None review button clicked, activities start and
stop at the times given in the Scheduled Start and
Finished columns without interaction by the user. This
is the easiest case for the users, but it assumes the unlikely
result that activities are completed at their expected durations.
This is satisfactory with deterministic times, but not practical
for random times. With the "Elapsed >= Min"
button clicked, an in-progress activity is reviewed when its
elapsed time is at least as great as the minimum time given
in the data. When the All in Progress button is clicked
every activity currently in progress is reviewed. We illustrate
below the second case. The review decisions must be made carefully
because they change data on the worksheet that are sometimes
difficult to reverse. Of course in practical instances it is
not possible to go backward in time.
With the "Elapsed <= Min"
option, the review process considers activities that are about
to begin and those that are in progress and asks the user
what has happened during the interval from the current time
to the new time. For the example, three activities are scheduled
to begin at time 0, A, B and C. The first
activity considered is A. The program presents the following
dialog.
We assume that it did begin, so we click the Yes
button. The program then asks exactly when it began.
We enter 0.5 as an example. Next the program asks
about activity B.

In this case we answer no. The program then asks
how long it will be delayed.

Since there is a large slack for B, we delay it
10 hours. The review continues for activity C and we say that
C begins at time 0. In this way the project data is updated
as below. Notice that the length of the critical path has increased
to 57.5 because A was started late. |
| |
|
| |
|
| |
| |
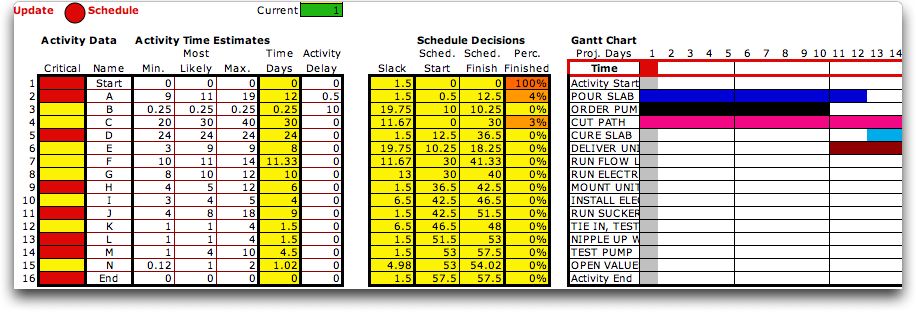
The current time
is now 1. A gray area on the Gantt chart shows that one day
has passed. The Percent Finished column now has nonzero
entries showing the percentage finished of each activity.
Activities with 100% are complete. These are colored dark
orange. In-progress activities have percentages strictly between
0% and 100%. These are colored light orange. The remainder
of the activities have not yet started and are yellow. The
black bar for activity B shows the delay of 10 hours. Activity
B only requires 0.25 hours, so its time does not show on the
Gantt chart.
Review of the data will show that the two activities in progress,
A and C, have minimum durations of 9 and 20. respectively.
The next activity due to start is B, at time 10, so nothing
is due to happen from hours 1 through 9. Using the update
button, we advance to time 10. At time 10, activity A has
an elapsed time of 9.5 hours that is larger than the minimum
of 9. Since it could possibly be finished, the program presents
a dialog below. Clicking the activity finished button
will indicate the activity is finished. Otherwise the estimates
for the activity time may be changed. Since the activity is
in progress, more information about its completion time may
now be available. We assume the activity did not finish, so
click OK.
Activity B is due to begin at time 10. The program
asks if it did. We answer that it has.
Since B is very short, it may also finish during
the interval. We answer Yes.
We specify the finish time as 10.5.
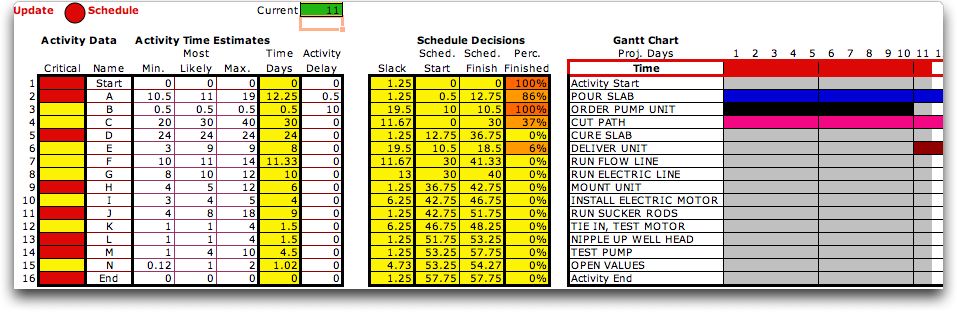
At time 11, the partially completed project is
shown below. Notice the minimum activity times are adjusted
as the activity progresses. The activity time for A was originally
9, but since it has not finished by time 11, the minimum must
be at least 10.5 (the activity started at 0.5). Similarly, since
B has finished with at time of 0.5, the minimum, most likely
and maximum times for B have all been set to the duration observed,
0.5. |
| |
| |
The update and review process continues
until the project is complete. The three time estimates for
an activity become the same as activities are completed, so
the variance of the project duration decreases as the current
time increases.
The process considers activities in precedence order, that
is, an activity is reviewed before any of its successors. This
is necessary because decisions regarding the delay or time estimate
for an activity will affect the scheduled start times of its
successors.
It is always possible to update data directly on the worksheet
rather than through the review dialog. For most changes the
results on the worksheet dynamically recompute. For changes
in the project structure, defined by set of activities and the
precedence relations, the model must be rebuilt by clicking
the Solve button. Click the Schedule button
to rebuild that worksheet after a change in the project structure.
The review process will increase an activity's delay when the
activity starts after its scheduled start time. There is no
opportunity, however, to decrease a planned delay during the
review. This is particularly important for delays on the critical
path as these affect the project completion time. After an update
operation, the manager should play close attention to the delay
column for the critical activities and reduce the delays where
possible and advisable. |
|
| |
There are three alternatives for
displaying the activities: In Progress, Critical and
All. The last option shows all the activities as illustrated
above.
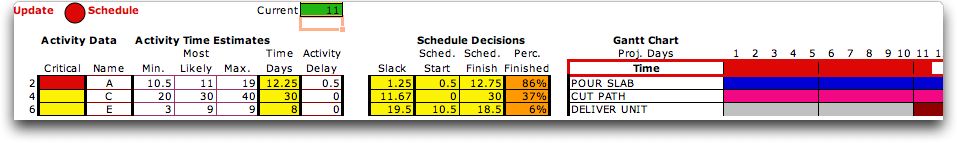
The Critical option shows only the critical activities.
This is useful because the project completion time is sensitive
to these activities. With this display the analyst can focus
on the important estimates. The figure below shows the results
after 11 hours.
The program constructs the display by hiding some
of the rows of the worksheet. The information is not lost, however.
The rows will reappear when a different display option is chosen
or if the user selects all the hidden rows and chooses the Format/Rows/Unhide
command from the Excel menu bar. Hidden columns can be displayed
with the Format/Columns/Unhide command. |
| 
|
| |
The final display option shows only the activities that are
currently in progress. These activities are important because
the impact of current events such as weather and resource availability
are most apparent while the activities are in progress. |
 |
| |
The update procedure
is extremely important for on-going project management. Based
on new information, completion dates may change, due dates may
have to be adjusted and future activities may have to be rescheduled.
It is even possible that the project structure may change over
time. These changes are easily accommodated by using the various
features of the add-in. |
| |
|
|