|
|
 |
Project
Management |
 |
-
Scheduling |
 |
The Schedule button creates a worksheet where the activities
of the project may be scheduled with actual start times. When
the project involves limited resources, it may be necessary to
delay activities beyond their earliest start times so that overuse
of resources is reduced or the level of variability of resource
use is reduced. When cash flows are defined, the cash flows vary
in time depending on the schedule of the project activities. Activity
scheduling also determines when the project will be complete.
The scheduling worksheet provides a variety of tools to investigate
the effects of activity scheduling and determine an optimum schedule
by some measure. One of the principal tools is the Gantt chart.
|
Clicking the Schedule
button at the top of the activity worksheet presents the
dialog to the left. For purposes of constructing the Gantt
chart, time is divided into discrete intervals called
time buckets. The interval may be any positive
number that gives a Gantt chart with no more than 100
columns. The most convenient intervals are integers. The
interval is entered into the Time Bucket field
of the dialog.
The default Time Horizon is the greater of
the due time of the project or the completion time of
the schedule on the project worksheet. The latter may
be larger if the schedule is late. The Extra
Time is
the time beyond the time horizon that the completion
time might be delayed by the schedule. The sum of the
time horizon and the extra time is the maximum time
for the Gantt chart. The program limits the total number
of intervals in the Gantt chart to 100. The maximum
time divided by the time bucket must be less than 100,
so the time bucket cannot be too small. |
Two methods are provided for dealing with resources. The Limit
option specifies a limit for each resource and penalizes any
usage above the limit. We try to find schedules that minimize
resources used above the limits. The Level option computes
the variance of the usage over time. Here we try to find schedules
that level the resource usage by minimizing the variance.
Clicking OK constructs the Schedule worksheet on
which schedules can be evaluated and optimized. This is particularly
useful when a project uses limited resources or involves cash
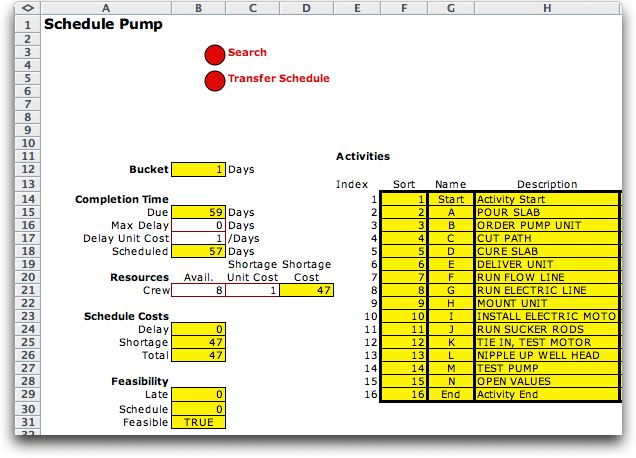
flow. Part of the worksheet constructed for the example is
shown below. Formulas link the data in column F through I
to cells on the project worksheet. Most of the cells on the
schedule worksheet are yellow indicating that their contents
are computed with formulas. This is an important distinction,
because the formulas are destroyed if the user types values
in these cells. Cells with
Columns B through D holds data and results for the schedule.
Cell B15 holds the due date entered on the project worksheet
and B18 holds the completion date for the current schedule.
For illustration we have set the crew availability to 8 and
the shortage cost of 1 for each crew used in excess of 8. We
will discuss other aspects of the solution below. Columns F
though H hold data transferred from the definitions on the
project worksheet except that on the schedule worksheet the
activities are listed in precedence order. For the example,
this does not change the order, but that is not true in general. |
Schedule
|
| |
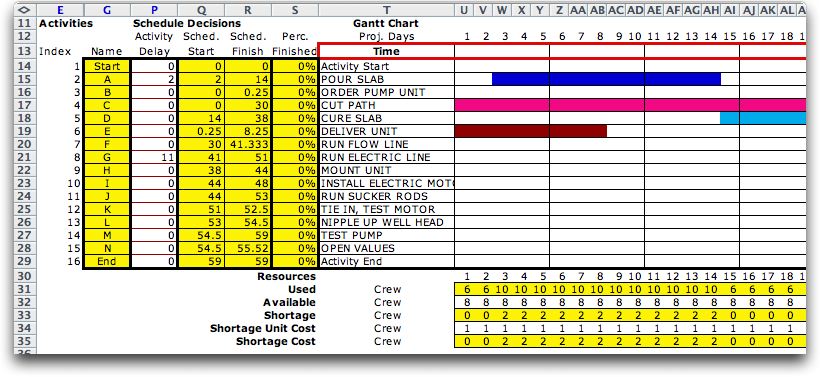
The figure below shows the schedule information on the schedule
worksheet. All the columns shown in yellow are governed by
formulas. The delays shown in column P may be changed by the
user to affect the schedule. Ultimately, column P will
be manipulated by algorithms provided by the add-in to search
for the optimum schedule.
Times in column J are the mean activity time values. Columns
K through N use critical path analysis to compute early and
late start times. The resultant slack appears in column O.
The slack value is the how much the activity may be delayed
without extending the finish date of the project. Column P
holds the delay decisions. The initial contents of this column
are the delays entered on the project worksheet. We color column
P white to indicate that it may be manipulated by hand, but
the computer will replace its contents when the Search
button is clicked. As the delays change, the slack values will
change as well as a number of other cells on this worksheet.
The start and finish times for the activities, in columns
Q and R, depend on the delays entered in column P. Column
S holds the percentage finished for each activity based on
the current time. The current time for this example is 0.
Most of the active cells on this worksheet are colored yellow
to indicate that they contain Excel formulas. The formulas
makes the results dynamic. When data for activity times or
resource amounts change, for instance, the results are automatically
adjusted. If the number of activities or any of the precedence
relations change, this worksheet is no longer valid. The revised
project must be solved with the Solve button on the
project worksheet. The Schedule worksheet must then
be rebuilt using the Schedule button
on the project worksheet. |
|
| |
A Gantt chart is shown to the
right of the activity data. This is a dynamic chart that changes
as the delay entries are manipulated. The colors of the
Gantt chart are defined on the project worksheet.The chart
stretches across the worksheet for as many intervals as required
by the completed project. The current time is 0 for the example
and the chart shows the early start schedule. Activity B
is very short and is not shown on the chart because of the
discrete time bucket of 1. Similarly, times with fractional
values are adjusted to integer values for the display. For
example the start time of E is 0.25 is rounded down
to 1 for the display. |
| 
|
| |
Below the chart, are
rows that compute the amount of each resource used in each interval.
For the example, the single resource is shown in row 31. The
numbers in row 32 are the amounts of the resource that are available.
The example uses a limit of 8. These numbers are linked to the
the number in cell B21. The numbers can be varied manually to
represent the amounts available during the various intervals
of the schedule, but the link to cell B21 will be lost. Row
33 holds the amounts of the resource used that exceed the amounts
available, or the shortages. The example shows a shortage of
2 for the first 12 periods. Row 34 holds the unit shortage cost
that is linked to cell C21. Again the entries in this row may
be manually adjusted if the cost varies with time. Row 35 holds
the product of rows 33 and 34, the cost of the shortage for
each interval.
We focus on the recourse calculations
to show more columns. The shortage is 0 for periods 13 through
30 and then goes to 1. The total shortage cost or this solution
is 47. |
|
|
| |
 |
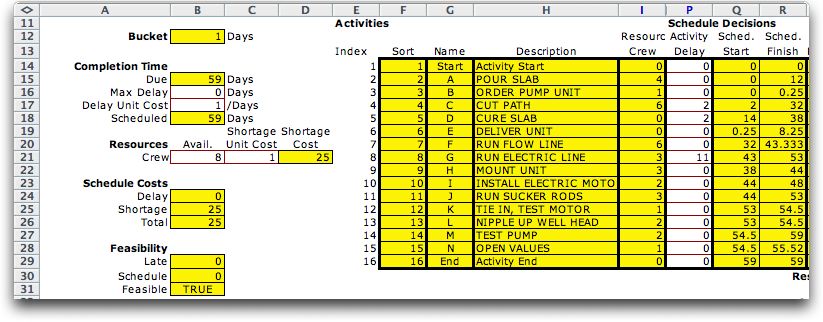
The results for this schedule are shown in columns B
through D. The Due time in B15 is transferred
from the project worksheet. The Max Delay is
entered by the user in B16. This is the time that the
project may be delayed beyond the due time. If the schedule
on the project worksheet was late when the schedule worksheet
was created, the late value is entered here. The entry
in cell B17 is the cost per unit time associated with
this delay. The Scheduled completion time is
57 (cell B18).
Starting in row 21, the cells in column B show the availabilities
of each resource. Column C shows the unit cost of exceeding
the availabilities. Columns B and C are entered by the
user. Column D holds the computed cost of shortages for
the current schedule.
The evaluation of the schedule starts in row 24. Cell
B24 computes the cost due to project delay and cell B25
holds the total resource shortage cost. The Total
cost in B26 is the sum of the delay and shortage costs.
When we optimize, this is one of the measures that can
be included in the objective function. |
Feasibility conditions for the schedule start in row 29. The
Late entry in cell B29 is the difference between the
Scheduled Completion time and the sum of the Due
Time and the Maximum Delay. The program does not
accept a solution when this value is greater than 0. The Schedule
entry in cell B30 is the sum of the times the activities start
before their earliest start times. Again, the program does not
accept solutions that violate the start times restriction. The
entry is cell B31 is True only when both of the preceding
amounts are 0. Otherwise it is False. The automatic
search process checks this cell as it varies the solution to
assure that only feasible solutions are considered. |
Search |
| |
A specific schedule
is obtained by entering nonnegative numbers in the activity
delay column. Delays must be multiples of the Time Bucket.
A positive delay for some activity will change the schedule
limit columns and slack column. Any one delay may be increased
by the amount shown in the slack column or decreased by the
amount of the current delay. As long as the slack column remains
nonnegative, the schedule will be feasible. The figure below
shows a schedule with activity A delayed for 2 hours and activity
G delayed for 11 hours.
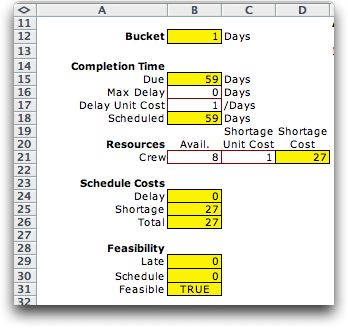 |
Delaying activities automatically changes the Gantt chart
and correspondingly the amounts of resources used by the
schedule. The results are automatically reflected in the
cells of columns B and C. The results for the revised
schedule are shown at the left. The total shortage is
now 27. This was accomplished by delaying "Pour Slab"
by 2 hours and "Run Electric Line" by 11 hours. |
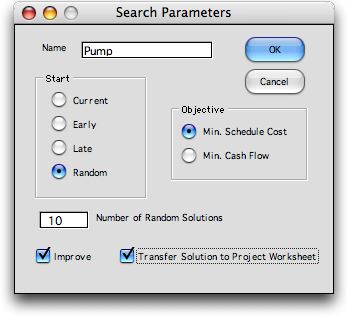
We have programmed a random search process that seeks better
solutions. This heuristic is called by clicking the Search
button at the top of the worksheet. The dialog below offers
the opportunity to either improve the current solution, early
start solution, late start solution or to generate random solutions.
The number of random solutions is entered in the field at the
bottom. Here we have chosen to generate 50 solutions at random
and improve each solution with a heuristic procedure.
When the Improve box is checked, the heuristic is
applied to the starting solution and each random solution. The
Transfer button at the bottom, transfers the solution
to the delay column on the project worksheet.
The improvement process considers the activities
in order of increasing index, starting at activity 2 (activity
1 is the start activity). If the delay for the activity is not
zero, the delay is reduced by 1 time interval. If the cost decreases
or remains the same, the delay is reduced further until the
cost increases. If the delay is 0 or if reducing the delay results
in a cost increase, the delay is increased until the solution
cost does not change or increases or until no slack remains.
When the next to last activity is complete (the last activity
before the end activity), the process has either improved the
solution or not. If it has improved the solution, the process
repeats, starting again at activity 2. If there is no improvement
for a complete cycle through the activities, the improvement
process terminates.
The solution increased the duration of
the project to 59 and reduced the shortage cost to 25. The
solution with the delays and the resultant schedule are shown
below.
A random search selects activities in random order. If the
slack for the selected activity is greater than 0 a random delay
is generated which is an integral multiple of the time interval.
The delay of each activity is randomly generated in this fashion.
The improvement process is then applied to the completed solution.
The process generates the specified number of solutions and
chooses the best. In the few cases we have tried, the random
search process has been quite successful. With sufficient time,
the number of random solutions can be set to a very large number
to increase the chance of finding a good solution. |
Update |
| |
During the update procedure, the parameters
on the schedule worksheet are automatically adjusted through
the formulas on the worksheet. For a current time greater than
0, some activities may have already started or finished. The
delay times for these activities will not be changed during a
search process. Thus the solution produced recognizes that
events already passed cannot be adjusted in time. The search
process only affects events yet to occur. |
| |
|
|


