 |
Clicking the Solve button creates additional structures
on the worksheet and solves the problem of finding the Critical
Path. This is called the critical path analysis.
We provide the theory for this analysis in the Design
section while here describing the solution with the add-in.
The critical path identifies those activities that must be
performed in strict sequence and with no delays so that the
project is finished in the shortest possible time. The add-in
shows the activities on the critical path with Red
bars in the Critical column. The figure below shows
the worksheet after the problem has been solved and after the
Critical button has been clicked. |
|
|
| |
Critical Path summary
results are shown at the top of column S. We have changed the
due time in S2 to 59 hours. We see in S3 that the smallest expected
time to complete the critical activities is 57 hours. The variance,
shown in cell S4, is the variance of the sum of the times for
the critical path activities. The standard deviation in S5 is
the square root of the variance. The expected time for the critical
path is not exactly the same as the expected time to complete
the project. When activity times are random variables, one cannot
identify a unique set of activities that will surely be on the
critical path. The results of column S assume that the activities
on the critical path are the same for all realizations of the
random times. Since this is not always true, the results in
S are only approximations.
Cell S6 computes the probability that the project will be complete
by the due time entered in cell S2. For the example, the probability
that the project will be finished within 59 hours is 0.7142.
The computation of S6 assumes that the sum of times on the critical
path has a Normal distribution. This is a good approximation
when there is a large number of activities on the critical path.
It may not be very good for this small example.
The precedence relations that determine the sequence of activities
on the path are shown as green cells in the Predecessor
range. This display is created by clicking the Critical
button at the top of the page. For the example, we
see that activities A, D, H, J, L and M are critical. The predecessor
relationships (A, D), (D, H), (H, J), (J, L) and (L, M) determine
the critical path. Not shown are the relationships (Start, A)
and (M, End). These are also included in the critical path. |
Critical Path Computations
|
| |
Starting in column U,
we find columns with scheduling details for the activities. In
the figure below we have hidden several columns and revealed columns
U through Z to show the computations. In order to find a solution
it is necessary to sort the activities so that each activity is
listed after all its predecessors. There is no guarantee that
the user will enter activity data in the proper order, so the
add-in creates the order required for the computations. Column
U shows the indices of the nodes in the Project Network
(described later) that refer to the
activities. For the example the Sort column is the same
as the index column, so the initial activity list is in the proper
order. Column U is colored green to indicate that the add-in has
filled this column using an algorithm. |
|
|
| |
Columns V through Y show information necessary to schedule
the activities. The Early Start is the earliest time
that the activity may start. This number is based on the earliest
time that all of the predecessor are completed. The Late
Finish time is the latest time the activity may finish
without delaying the completion time for the project beyond
the due time. The Early Finish time is the Early
Start time plus the activity time. The Late Start
time is the Late Finish minus the activity time.
The Slack time is the difference between the Late
Start and Earliest Start times. This is the time
an activity may be delayed without forcing the expected completion
time to be greater than the due time. The example shows that
the minimum slack time is 2, and several activities have this
value. Any one of these activities may be delayed by 2 hours
and the expected project completion time will be 59 hours, the
due time. The Critical Activities are those with slack
equal to the minimum. These are highlighted in red in column
C.
These computations are explained in the Design
section. |
Graph |
| |
A series of buttons appear at the top of the worksheet after
the problem has been solved. The Change and Critical
buttons were described earlier.

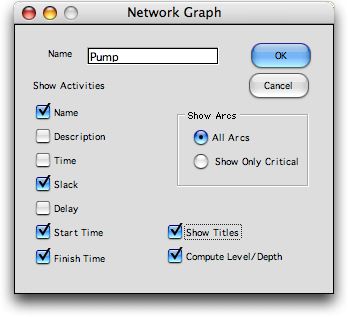
Clicking the Graph button presents a dialog with graph
options. A variety of activity data and results may be displayed
by clicking the buttons at the left. When the Titles
button is clicked a title is shown with each item. Of course,
the graph size depends on the number of buttons selected. The
graph will show All arcs or show only the Critical
arcs as governed by the buttons on the right. The latter is
clearer for a complex network.

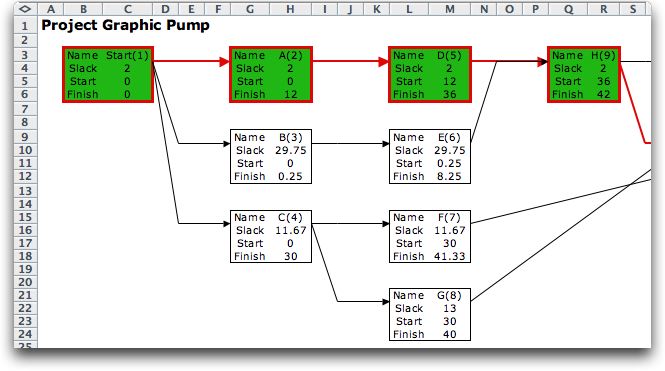
With these options part of the resultant graph is shown below.
Critical activities are shown in green and outlined in red.

The figure below shows the graph of the project network with
only activity names. This is a more compact display. |
|
Schedule |
| |
The critical path
computations provide the earliest and latest start times for
activities but do not set the actual starting times. With unlimited
resources, activities can all start at their earliest times.
With limited resources it may be necessary to delay start times
so that the resource limits are not exceeded, or at least violated
as little as possible. The use of delays is discussed more
fully in the Design section.
The worksheet holds additional columns that can be used to
specify a schedule for all the activities. Column R shows the
activity slack times. Column S specifies how much each activity
is delayed beyond its earliest start time. With all 0's as
shown, the activities begin at their earliest start times.
The Scheduled Start (AA) and Scheduled Finish (AB)
columns hold the planned times for all activities. As expected,
the scheduled finish time for the End activity, and
the finish time for the project is 57. The Percent Finished column
shows the proportion of the activities that are complete. Since
the current time is 0, none of the activities have started. |
| |
|
| |
A different schedule
is obtained by specifying delays for the activities. The figure
below shows the schedule when activity A is delayed by 1 hour.
Note that the completion time is increased to 58. This should
not be surprising since activity A is on the critical path.
The slack values for all activities on the critical path have
changed to 1, because the delay in A has used up part of the
slack on the critical path. If the delay for A were changed
to 2, the slack for all critical path activities would be reduced
to 0 and the completion time would equal to the due time, 59.
The slack values depend on the current assignment of delays.
The delay of any one activity may be increased by the amount
of its slack without delaying the project. |
| |
|
| |
If one increases the
values in the delay column, one cell at a time, in a manner that
the increase never exceeds the slack time available, the finish
time for the project remains less than the due date. If the delay
is increased by a value greater than the slack, the finish time
of the project is increased beyond the due date and the project
becomes late. The slack values are all adjusted to the new finish
time. The figure below shows a schedule with the delay values
assigned arbitrarily, while always staying within the slack limit. |
| |
|
| |
A schedule corresponding
to starting each activity at its latest start time is obtained
by starting at activity A and assigning each delay by an amount
equal to the current slack time. The resulting schedule is shown
below. All slack values are 0 and all activities are critical.
This method only works if the activities are listed in precedence
order. The Schedule page
provides an automatic method for finding the late start time
schedule. |
| |
|
| |
To this point, there
is no rational for choosing alternative schedules. With the Schedule button
at the top of the page, a new Schedule worksheet is
created that provides several measures and procedures for finding
the optimum schedule. This option is discussed in a later
page of this section. |
Gantt Chart |
| |
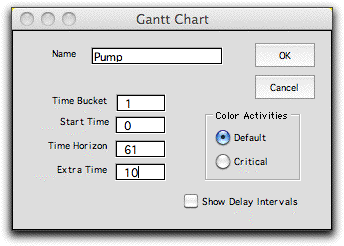
The Gantt Chart button
creates a chart to the right of the activity display. The Gantt
dialog sets features of the chart.

Each activity is assigned a color and the span
of the activity over time is shown as a colored bar. Part of
the chart is shown below. The schedule shown is the early
start schedule. The color of the bars is taken from the Color column
of the project definition. If the colors are changed in column
J, the Gantt chart must be rebuilt to reflect the color change. |
|
| |
Clicking the Critical option
in the Gantt dialog constructs a new chart with different colors.
Time bars for critical activities are red, and noncritical activities
are shown in maroon. |
|
| |
Different schedules are
dynamically reflected in the chart with the bars moving as the
delay column is changed. The entire chart is displayed below
by reducing the column widths for the chart portion to 1 and
reducing the screen magnification to 75%. This schedule has nonzero
delays. When the Show Delay Intervals box is checked,
the delays are shown by black bars on the chart. (The current version
shows gray bars instead of black.) When the box is not checked,
the delay intervals are not shown. |
|
| |
An interesting Gantt
chart is obtained if only the critical arcs are displayed. The
sequential nature of the critical path is clearly shown in the
figure below. This option is available with the Update button.
There is more information on the Update options on
the next page. |
|
| |
|


