 |
The examples to this point did not use the calendar so
that the illustrations could be simplified. In practice, however,
it is important to relate the project time measurement to calendar
time since actual operations run in calendar time. There are
two ways to construct a calendar. The easiest way is to check
the Calendar checkbox on the project dialog as illustrated
on the left. After the project is constructed, a calendar can
be built or modified by selecting the Calendar menu
item as illustrated on the right.
Calendar Checkbox |
Calendar Menu Item |
|
|
In either case, calendar options are entered on the Calendar
Dialog. The calendar has a start date, an end
date and an interval. The project start date
and due date are also entered here. The project start
and due dates can be changed after the calendar is constructed,
but the calendar is fixed unless it is later reconstructed.
The calendar range should be set large enough to encompass all
possible values of the start and due dates that might later
be chosen for the project. The calendar is limited to 300 entries,
so the calendar interval must be chosen with this limit in mind.
The dialog assumes that the project and calendar dimensions
are the same. Since we are using hours for the project, the
dialog assumes that hours will be the dimension of the calendar.
The contents of the field at the bottom is the number of project
intervals per calendar interval. When the two dimensions are
the same this number will be 1. It is possible however to chose
a different project interval than calendar interval. For instance,
the project interval might be "shifts". Then the bottom
field would hold the number of shifts per day. This might be
perhaps different than 1.

|
| |
| |
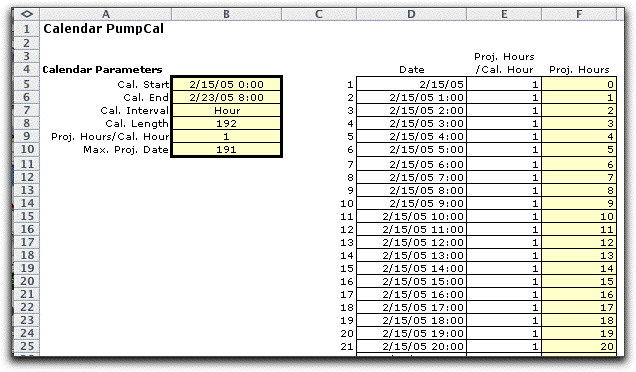
The add-in creates
a new worksheet called PumpCal_Calendar and constructs
the calendar as below. The calendar parameters are at the left
and the calendar starts in column C. Column C holds indices,
dates are in column D, factors relating the project to the calendar
units are in E and the project units are in F. Yellow areas
should not be changed. Although it is possible to change the
dates in column D, most often these will also be fixed. We will
see, however, that there are many instances where it is useful
to change column E to indicate calendar intervals that cannot
be used or are partially used by the project. |

Dates on the Worksheet
|
| |
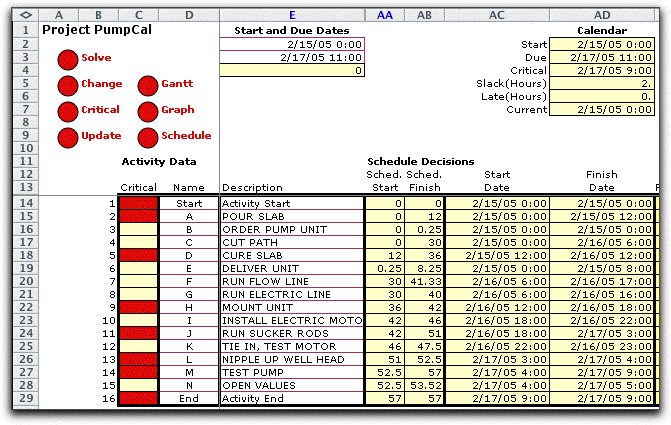
The first change immediately apparent
on the worksheet are the start and due dates. In most cases
these govern a project rather than the start and due dates expressed
in project intervals. With hours chosen as the dimension, the
dates are formatted with the "month/day/year hour:minute"
Excel format. Users familiar with a different date format can
change these with the Excel date formatting feature.

The yellow cell (E4) is the start date offset
from the calendar start expressed in the project time dimension.
This is nonzero whenever the project starts later than the calendar,
and it is computed by the formula in cell E4.
Further to the right on the worksheet new columns
are added to express the scheduled activity start and finish
times as calendar dates. When the calendar interval is day
dates are computed to the nearest day. The week calendar
shows dates to the nearest week. |

Gantt Chart |
| |
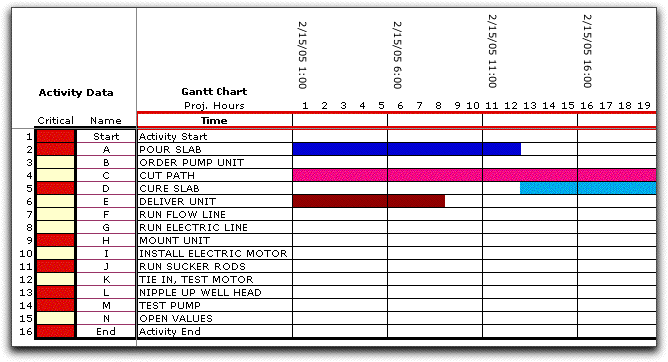
When
the Gantt chart is constructed, dates are added to the columns
of the chart for every five project intervals. |
| 
Adjustments to the Calendar |
| |
The calendar can be adjusted to
represent times and dates where work is impossible. For the
example, we assume that the work on the pump proceeds only during
the hours from 6 AM to 6 PM. The calendar is adjusted in column
E by placing 0's in hours when work is not allowed and 1's in
hours when work is allowed. Column F, showing project hours
since the beginning of the calendar, is automatically adjusted.
When looking for the date corresponding to a specified value
of project hours, the Excel formulas look in column F and return
the corresponding date in column D. |
|
| |
On the project page it
was necessary to change the due date until 2/19/05 14:00 to have
keep the slack value at 2 hours. The start and stop times for
the activities are adjusted to accommodate the new calendar. |

|
| |
The times on the Gantt chart are
similarly adjusted. Note that the divisions for the Gantt chart
are project hours, not calendar hours. The vertical lines every
five periods separate five project hours, not five calendar
hours. |
|
| |
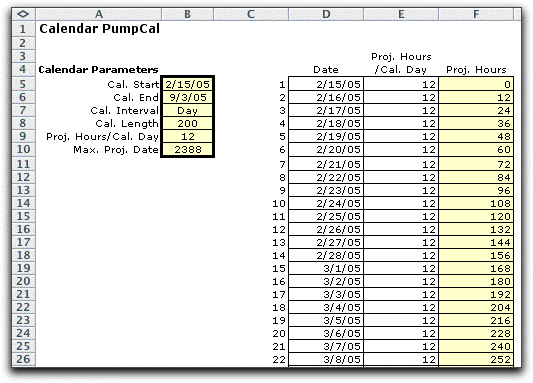
The figure below shows the calendar
with the calendar interval of days and the project interval
of hours. Each calendar day consists of 12 project hours.
With the days interval it is easy to represent work restrictions
on weekdays and holidays. The disadvantage is that all dates on
the project worksheet are expressed to the nearest day. This may
not be satisfactory when the project has durations measured in
hours. |

Usefulness of the Calendar
|
| |
Actual projects are scheduled in calendar times rather than
project times, and the calendar feature provides a link between
the project time units and calendar dates and times. The calendar
is also useful for specifying variability with respect to the
calendar. In the example, some hours allow work while others
do not. By changing the column holding project interval per
calendar interval (col. E), variations can be described and
reflected in the dates associated with the project. Other variations
regard weekends, holidays and partial workdays.
While the project is on-going unexpected events can also be
described on the calendar. An example would be the bad-weather
days that make work on construction projects difficult. It is
also possible that some days might be extended by overtime hours.
Entries in the calendar that represent these events are immediately
reflected on the schedule by changed completion dates. Unexpected
delays would suggest to the planner that remedial action must
be taken to reduce planned delays or activity times to meet
the project due date. |
| |
|


